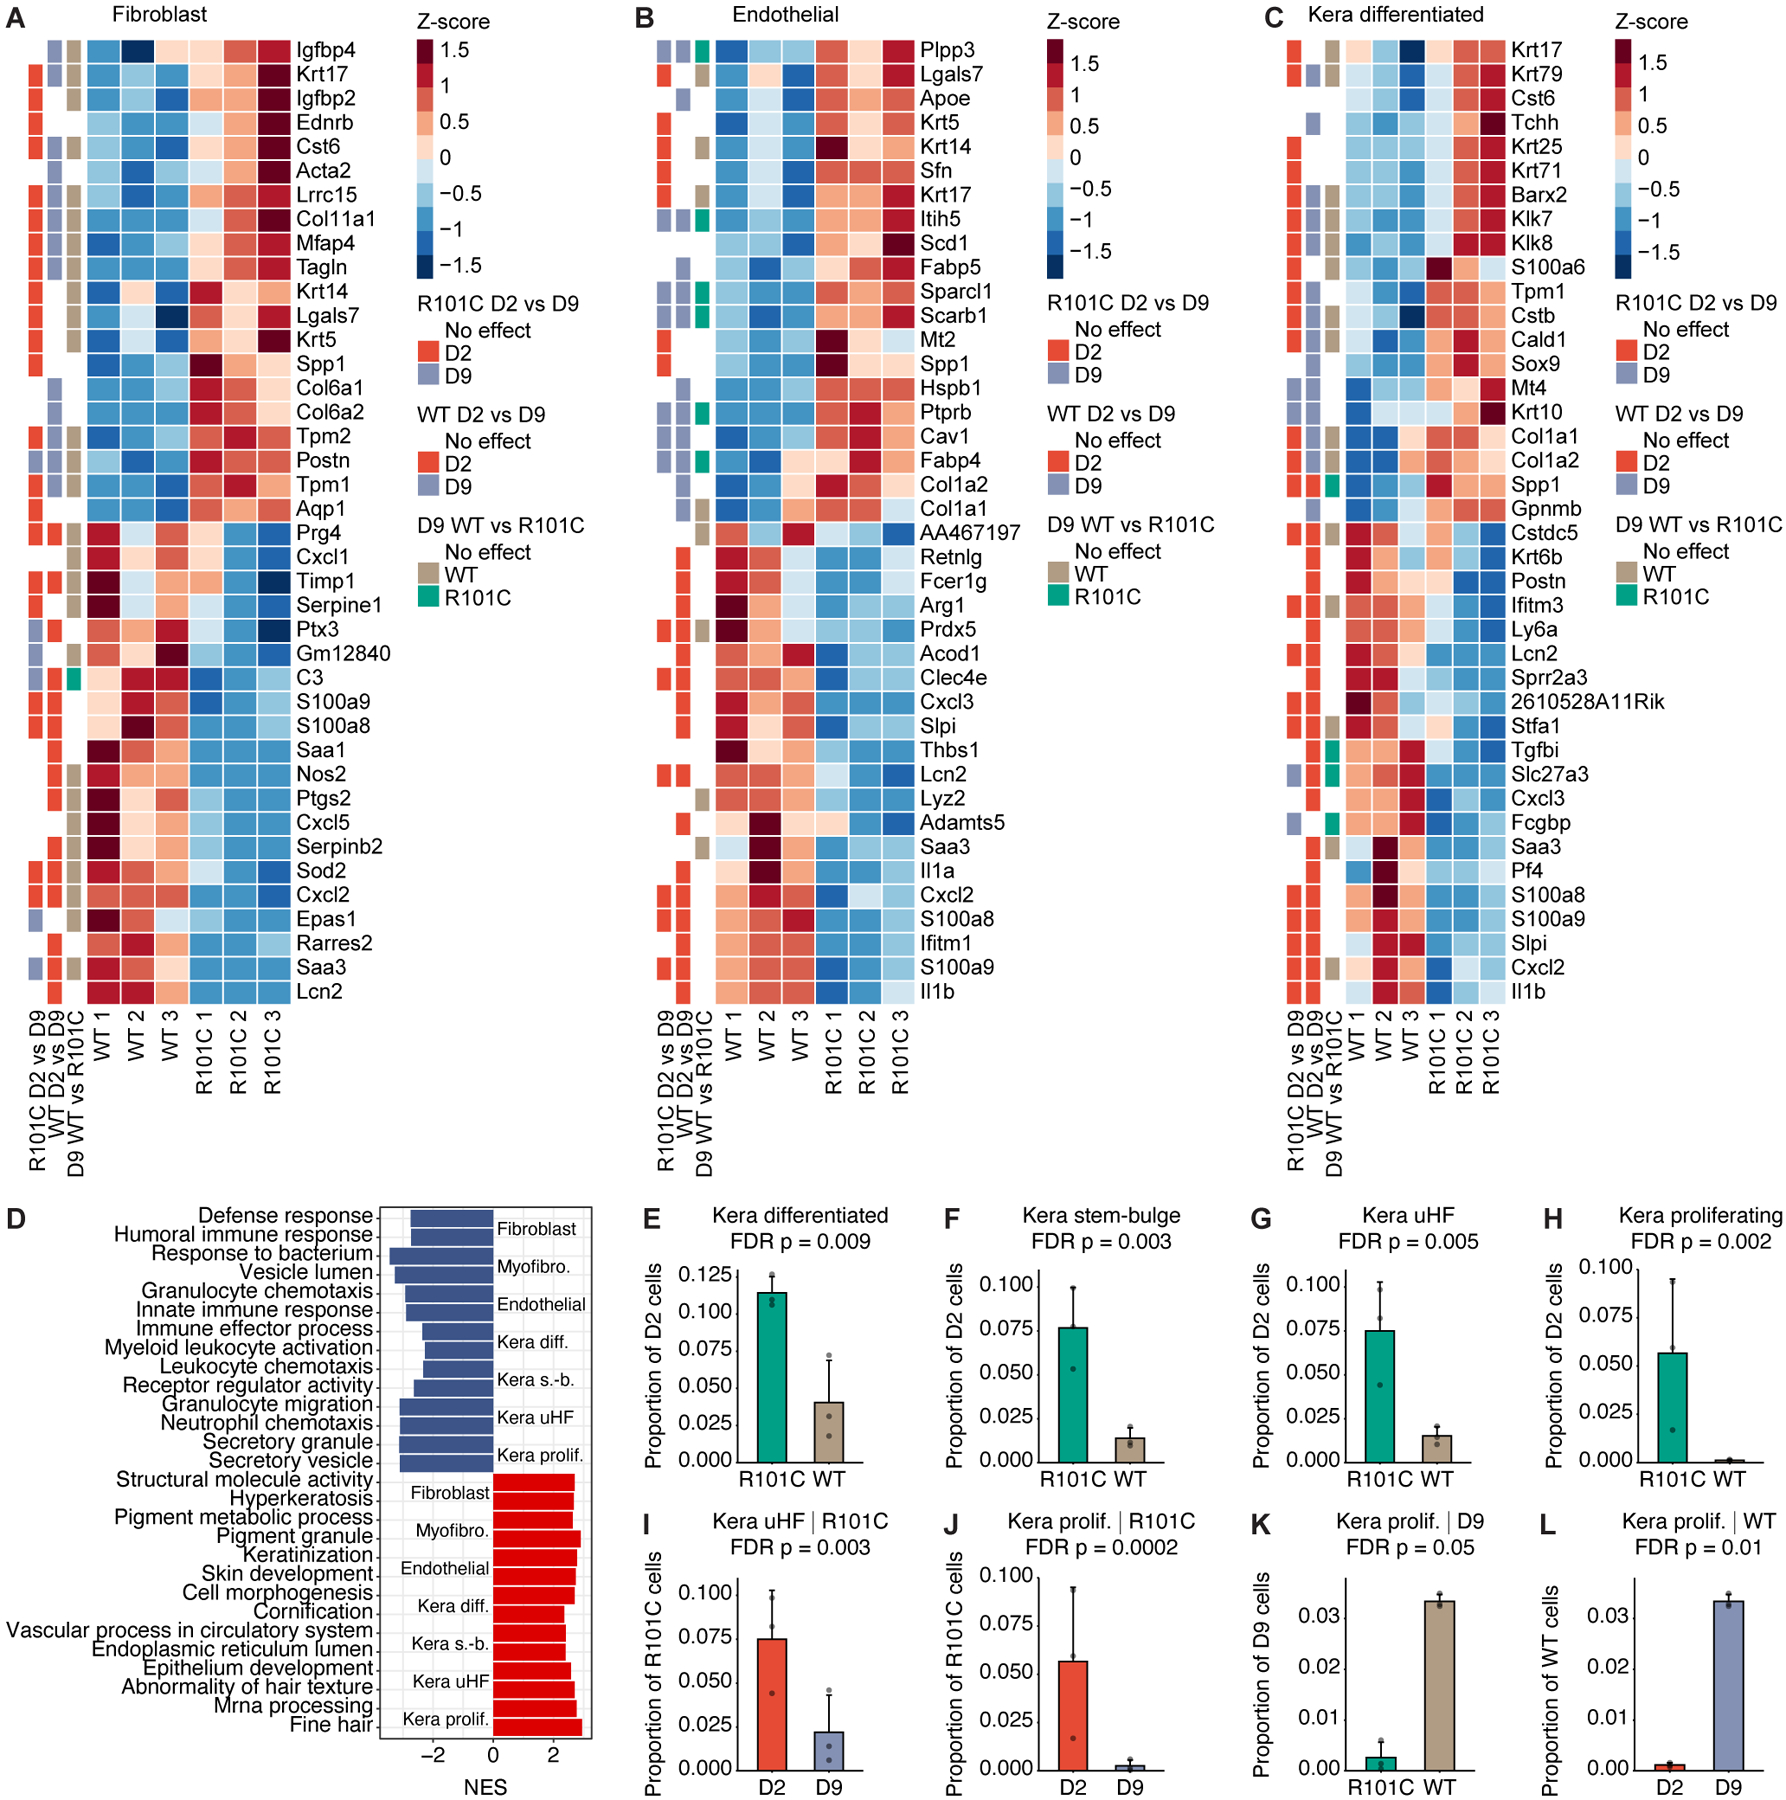
Figure 7. Cell non-autonomous effects of Card9 R101C.

A-C, Heatmaps depict top 20 upregulated and downregulated genes between D2 WT and R101C cells in the A, fibroblast, B, endothelial, and C, kera differentiated clusters. Row annotations show whether the gene is significantly differentially expressed in the R101C D2 vs D9 comparison, WT D2 vs D9 comparison, and D9 WT vs R101C comparison. D, Top pathways enriched in stromal and keratinocyte clusters based on DEGs between D2 WT and R101C cells within each cluster. NES indicates normalized enrichment score from GSEA; NES < 0 indicates upregulated in WT, NES > 0 indicates upregulated in R101C. E-H, Changes in keratinocyte cluster frequency between D2 WT and R101C cells. Specifically, plots show proportion of all cells at D2 in each sample for keratinocyte clusters with significantly different (FDR P < 0.1; Dirichlet multinomial regression) prevalence in WT and R101C cells at D2. I-L, Changes in keratinocyte cluster frequencies between D2 and D9 and between Card9 genotypes. Specifically, plots show proportion of all cells at the indicated timepoint in each sample for keratinocyte clusters with significantly different (FDR P < 0.1; Dirichlet multinomial regression) prevalence in WT and R101C cells or between D2 and D9. Plots are shown for significant comparisons. See also Figure S7 and Tables S3–S6.
