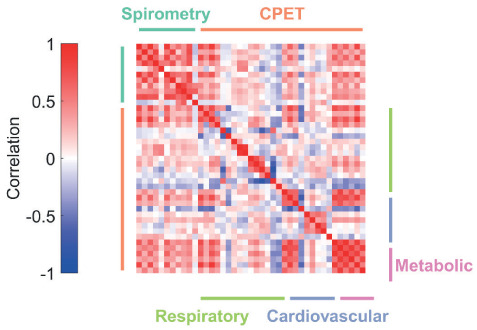
Figure 2.

Correlations between spirometry and CPET parameters. The strength and direction of the correlation is color coded as shown in the legend. Parameters are ordered, left-to-right and top-to-bottom, as shown in Table 1. The color of each cell in the correlation matrix thus represents the strength of the correlation between two parameters.
