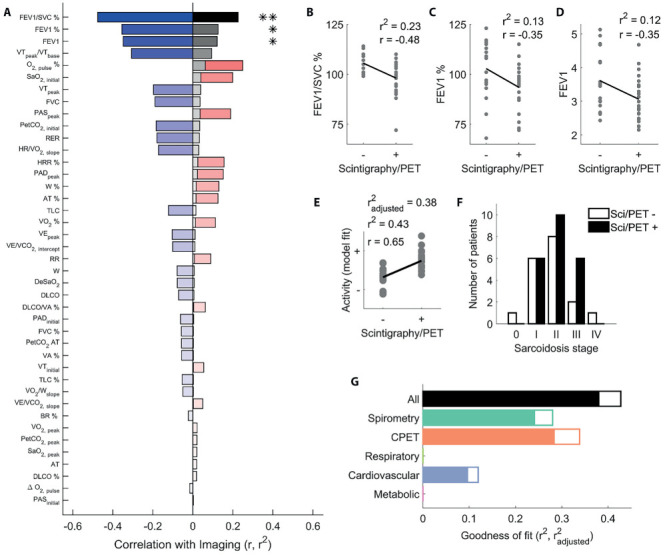
Figure 3.

Relating spirometry and CPET to sarcoid disease activity. (a) Correlation (r, red bars for positive, blue bars for negative) between all test parameters and nuclear imaging findings, ordered by proportion of variance explained (r2, grey bars). (b) FEV1/SVC%, FEV1% (c), and FEV1 (d) parameters plotted as a function of whether nuclear medicine examinations were positive or negative. (e) Disease activity (+ active; - inactive) recovered by fitting a multiple regression model to all parameters, as a function of positive or negative nuclear imaging findings. (f) Number of patients with positive (black bars) and negative (white bars) nuclear medicine examinations at each disease stage in our sample. (g) Proportion of explained variance for all multiple regression models constructed. Empty bars are r2, filled bars are r2adjusted, i.e. corrected for the number of predictors in each model. In panels b-e, dots represent individual participants, lines are best fitting linear regression fits. *P<.05; **P<.01
