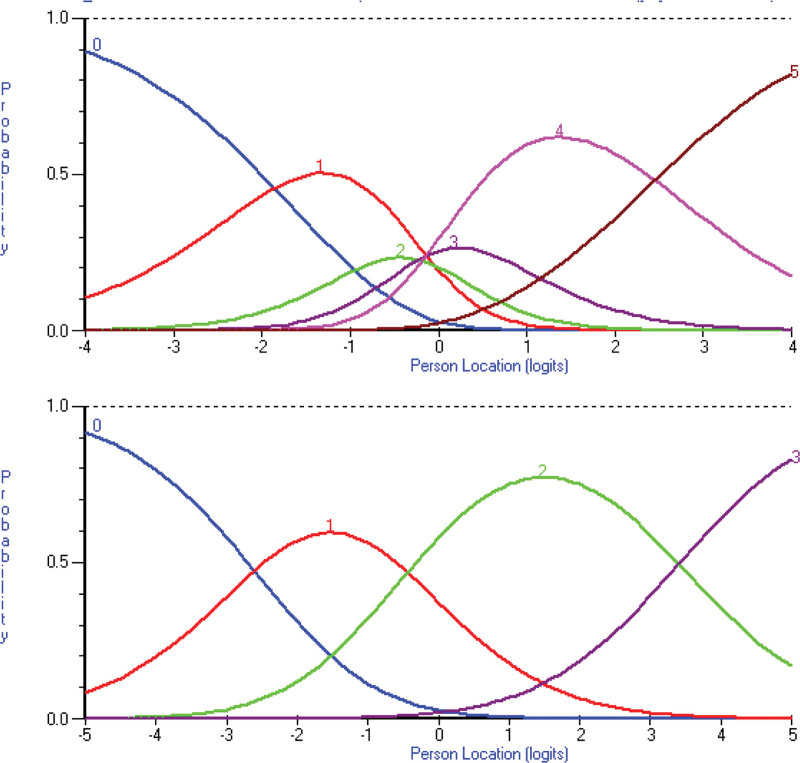
Fig. 3.
These two graphs show the category characteristic curves for item 8 “I know where to find useful information about my hearing device(s).” The colored curves represent the probability of participants selecting each response option. The top image depicts the category characteristic curves of the original six-point Likert scale (0 = strongly disagree; 1 = disagree; 2 = slightly disagree; 3 = slightly agree; 4 = agree; 5 = strongly agree) and the bottom image depicts a four-point Likert scale (0 = strongly disagree; 1 = disagree or slightly disagree; 2 = slightly agree or agree; 3 = strongly agree). Note that the categories are disordered in the original six-point Likert scale with the two middle categories not functioning as intended, but the categories are ordered in the rescored four-point Likert scale.

