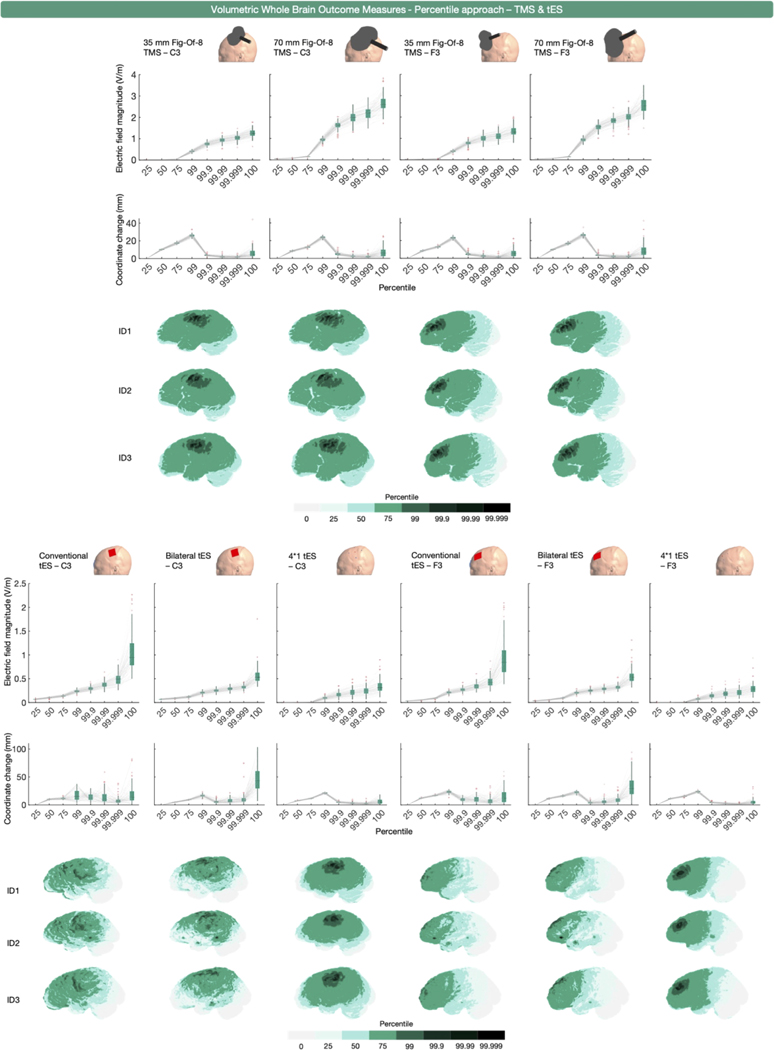
Fig. 2.
Volume-level, whole brain, percentile-based outcome measure for TMS (upper half) and tES (lower half) over C3 and F3. The upper row of boxplots shows E- field magnitude values obtained for different percentiles. The middle row of boxplots presents the mean coordinate position change of the tetrahedra associated with each percentile, compared to the previous one. The sharp drop in distance change (mm) with increasing percentiles starting from the 99th percentile can be attributed to the tetrahedra associated to the upper percentiles (> 99%) being numerically close compared to the tetrahedra associated to the lower percentiles. Collectively, these data indicate that the 100th percentile contains erroneous values (i.e., greater variability in E-field magnitude and coordinate change than similar iterative changes such as 99.99th to 99.999th percentiles). The volumes analyzed per percentile and modality are shown for 3 3 representative participants.

