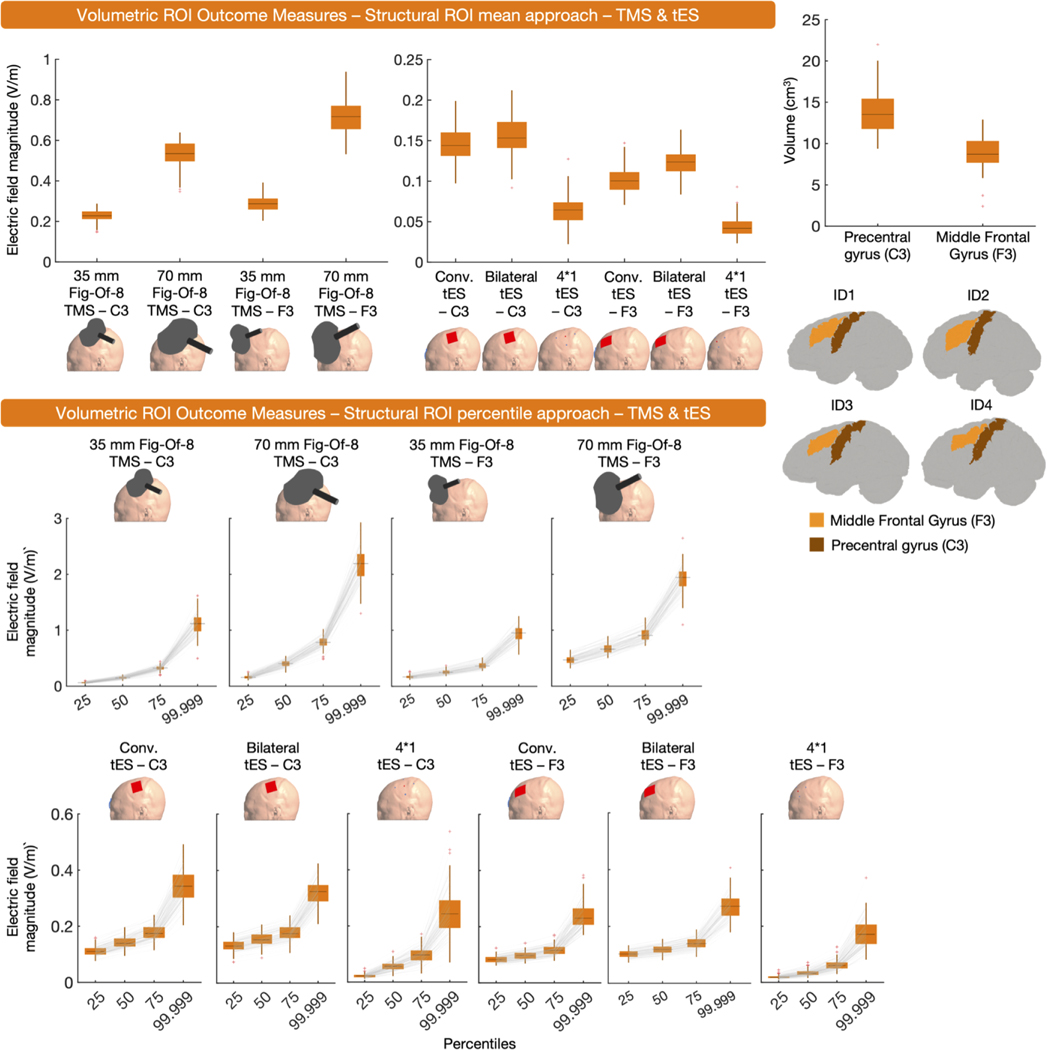
Fig. 4.
Volume-level, structural ROI, mean and percentile outcome measures for TMS and tES. In the upper right corner, the volume of each ROI and the ROIs in four representative participants are shown. The upper panel presents the mean E-field magnitude induced by TMS and tES in the structural ROI, while the lower panel shows percentile E-field magnitude values obtained from the ROIs for both modalities. 70 mm figure-eight TMS consistently resulted in higher E-field magnitudes, compared to 35 mm figure-of-eight TMS. Bilateral tES induced the highest E-field magnitudes in the ROIs of all tES modalities.

