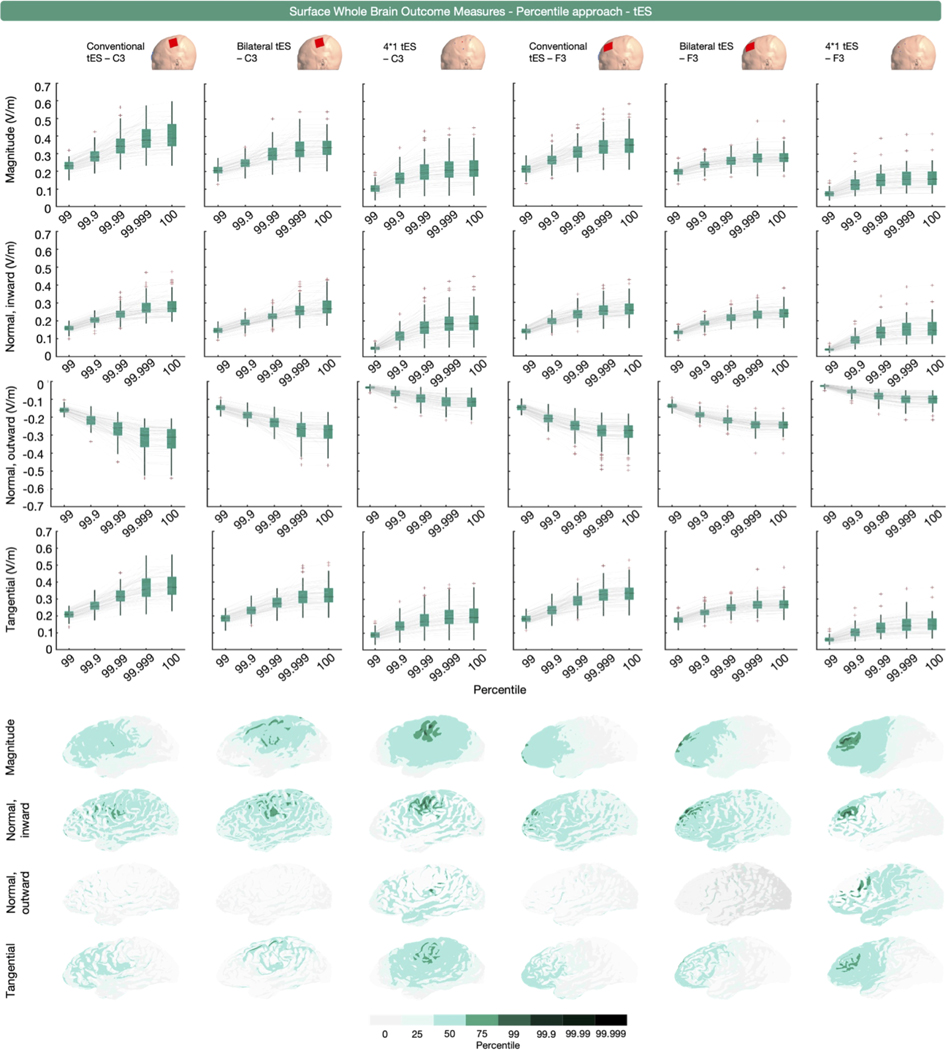
Fig. 8.
Surface-level (middle gray matter surface), whole brain, percentile-based outcome measure for E-field magnitude, and the normal and tangential components induced by conventional, bilateral, and 4 × 1 tES over C3 and F3. The upper four rows show the extracted E-field values using the top percentiles identified in our systematic review. The lower four rows show the areas analyzed per percentile in a representative participant. Substantial variations in the extracted areas are observed across the different E-field components.

