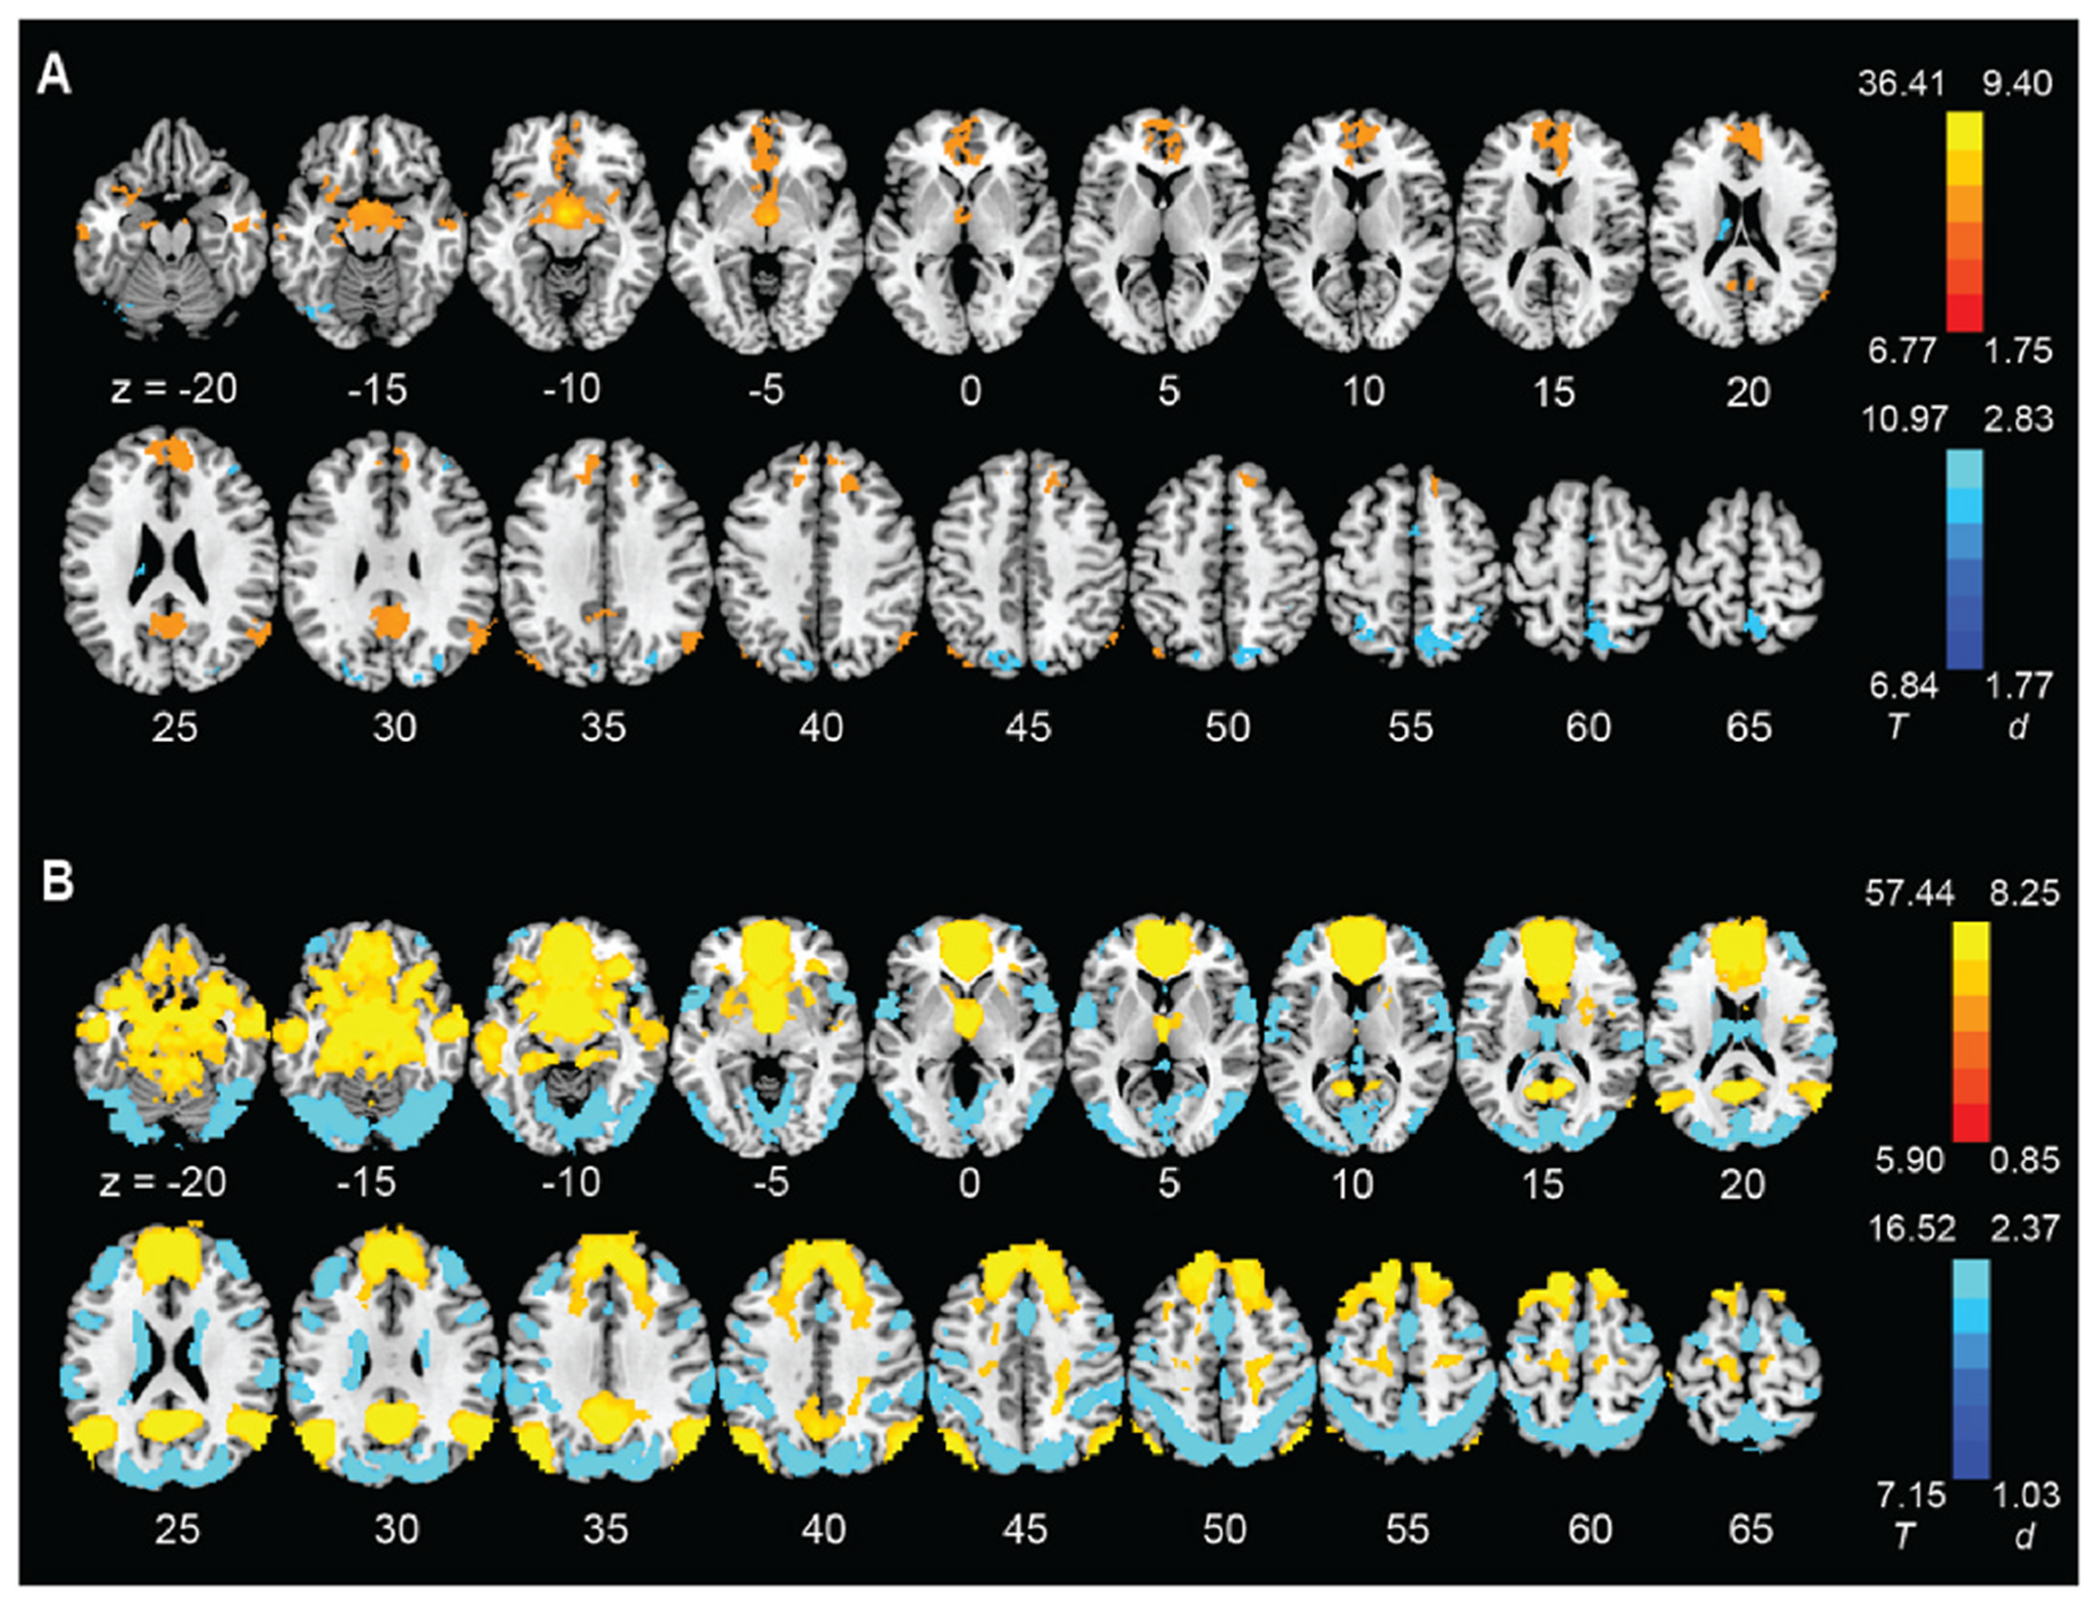
Fig. 1.

Whole-brain resting state connectivity of the hypothalamus (one-sample t-test, evaluated at voxel p < 0.05 corrected for family-wise error) in (A) smokers and (B) never smokers. Color bars show voxel T value and Cohen’s d. Warm/cool color: positive/negative resting state functional connectivity. (For interpretation of the references to color in this figure legend, the reader is referred to the Web version of this article.)
