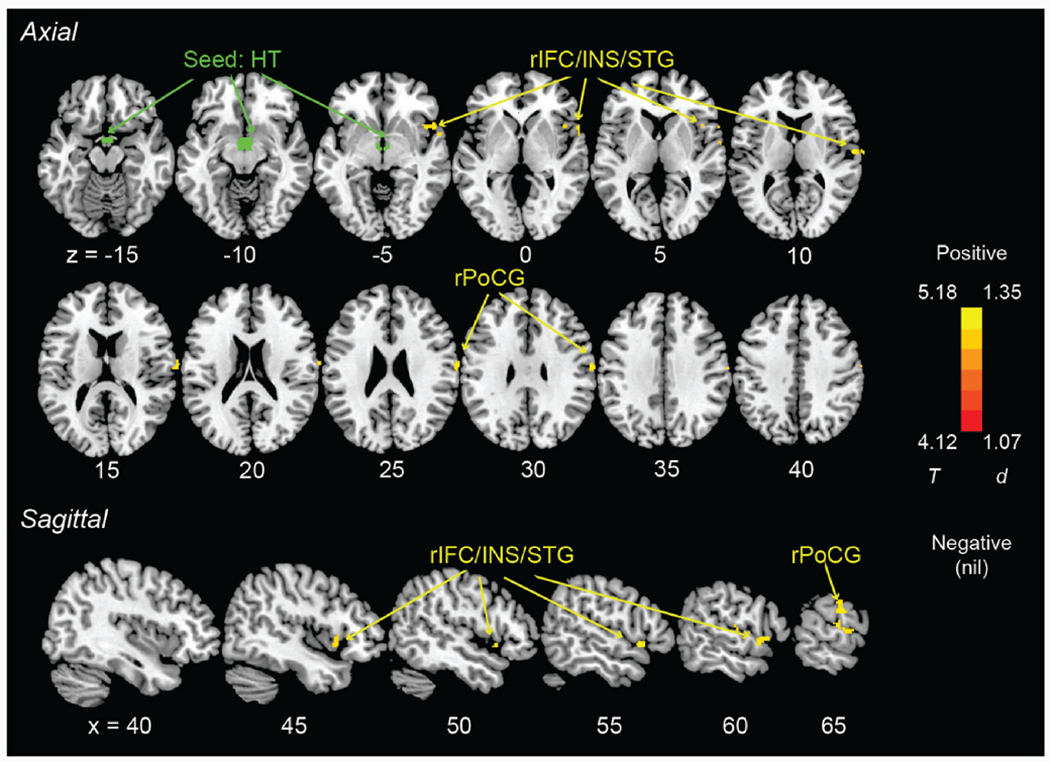
Fig. 2.

Seed of hypothalamus (green) and axial and sagittal views of clusters (warm color) showing hypothalamic rsFCs in positive correlation with PSQI score in smokers only (evaluated at voxel p < 0.001, uncorrected, in combination with a cluster p < 0.05, corrected for family-wise error), with age, sex, and drinking PC1 as covariates. Color bar shows T value and Cohen’s d. r: right; IFC: inferior frontal cortex; INS: insula; STG: superior temporal gyrus; PoCG: postcentral gyrus. (For interpretation of the references to color in this figure legend, the reader is referred to the Web version of this article.)
