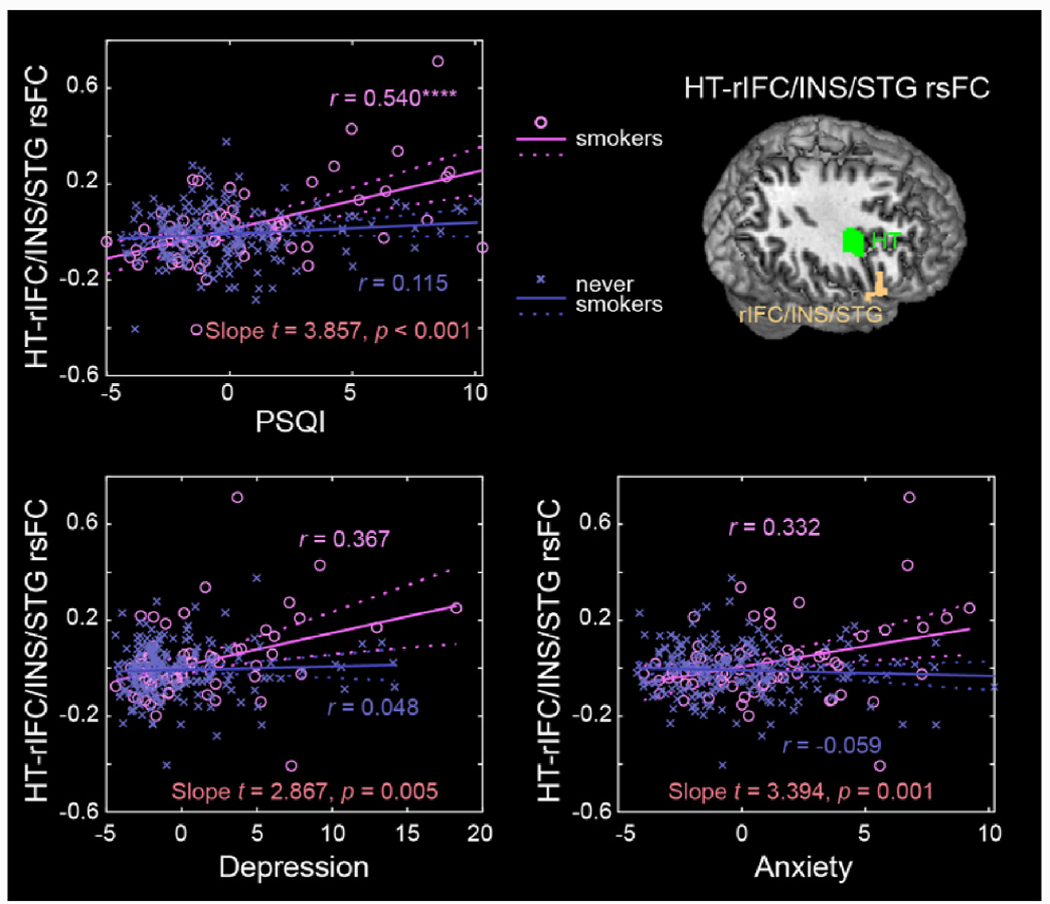
Fig. 4.

Scatter plots to show the correlations of hypothalamus-rIFC/INS/STG rsFC with PSQI, Depression and Anxiety Problems, with age, sex, and drinking PC1 as covariates for smokers and never smokers separately. Residuals are presented here. Solid lines represent the regressions. The r values are marked with ****p < 0.05/(23 × 2 × 2) = 0.00054 (correction for multiple comparisons). See Supplementary Table S3 for details.
