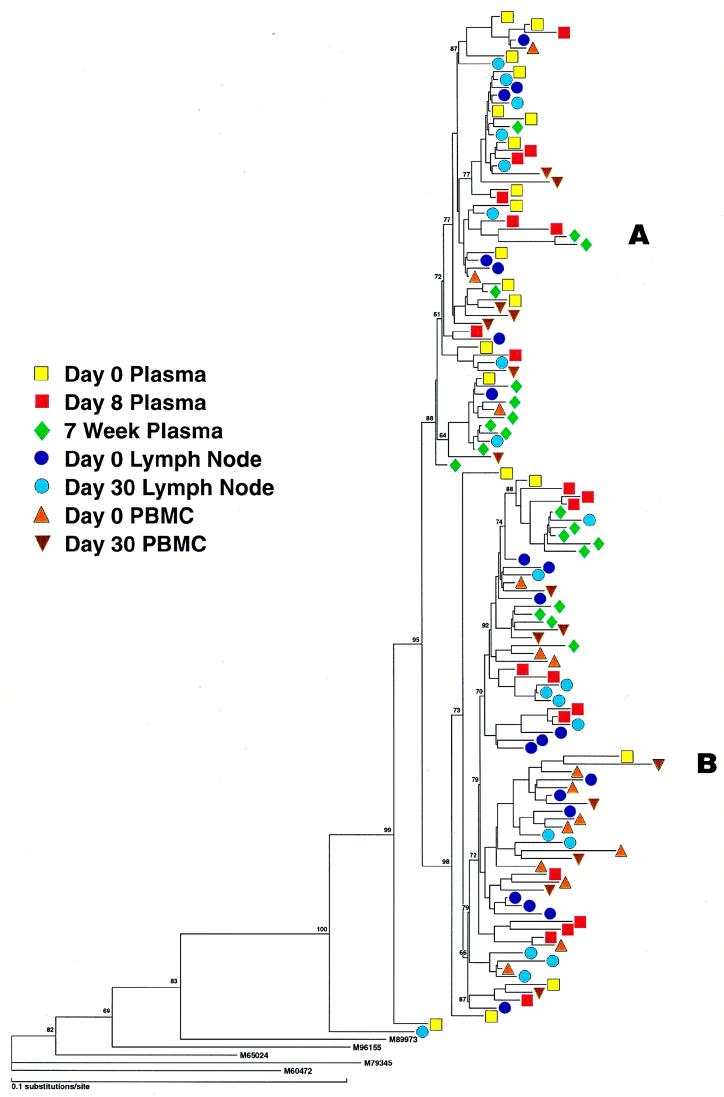
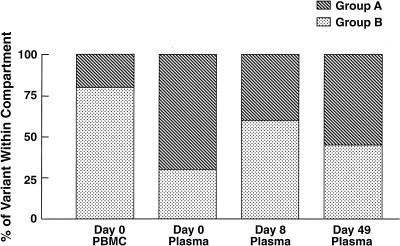
FIG. 3.
(Left) Phylogenetic analysis of sequences (cDNA and proviral) from patient 2. Samples from plasma represent RNA sequences, and those from PBMC and LNMC are proviral. Note two major groups, A and B, which are found in all compartments and time points sampled. Variant A was predominant in plasma, and variant B was predominant in PBMC at baseline. (Right) Frequency distribution of RNA variants in plasma and proviral variants in PBMC before and after immunization. For comparative purposes the proviral distributions of LNMC and PBMC at day 30 are not illustrated but are as follows: day 30 PBMC, group A, 35%, and group B, 65%; day 0 LNMC, group A, 35% and group B, 65%; day 30 LNMC group A, 45% and group B, 55%.


