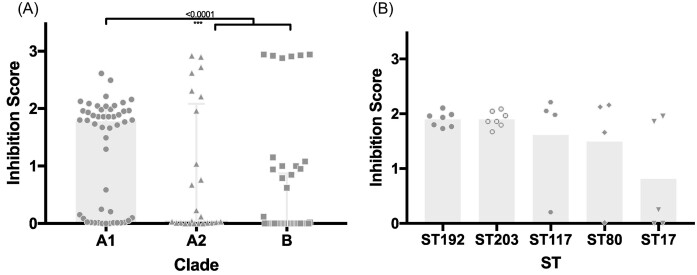
Figure 3.
Comparison of inhibition scores. (A) Inhibition score comparison between clade A1, A2, and B (E. lactis). (B) Inhibition scores of the clinically relevant STs of clade A1 with n>3. Bars show medians with interquartile range. Statistical analysis was performed using the Kruskal–Wallis test.

