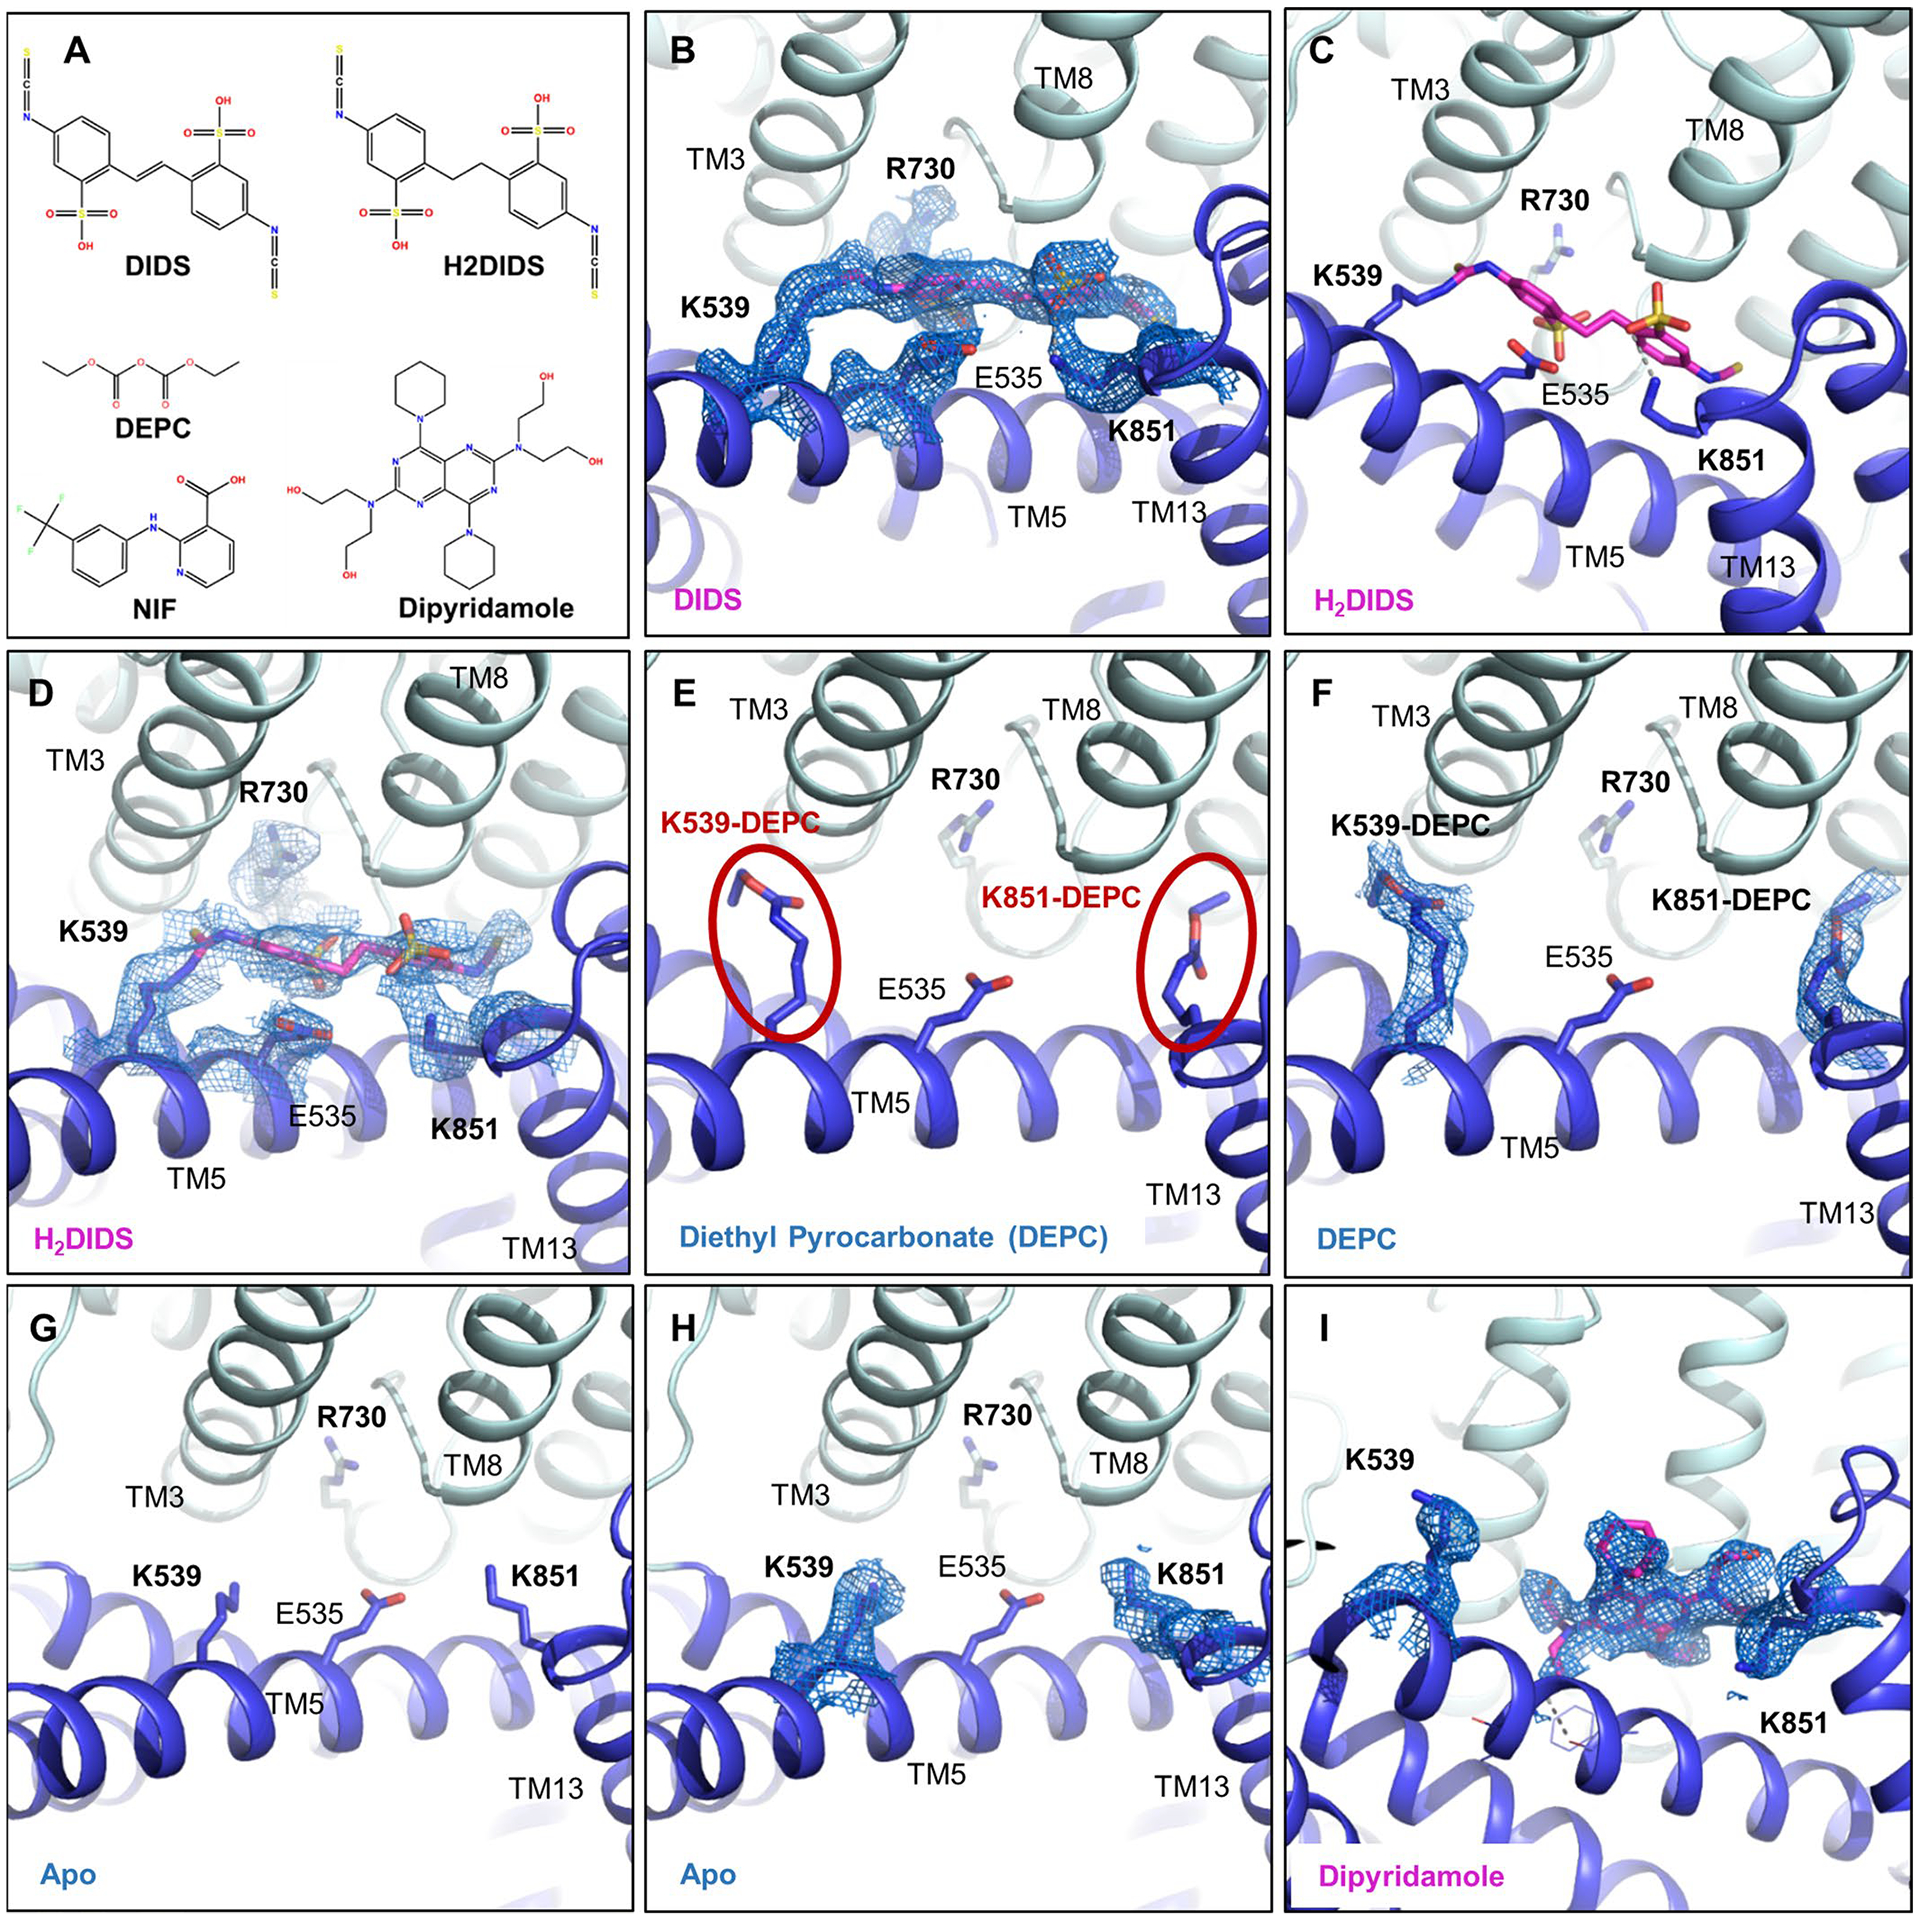
Extended Data Fig. 6 |. Structure and Density of AE1-Bound Inhibitors.

a, Chemical structures of different AE1 inhibitors and ligands used in this study. b, Cryo-EM density of DIDS (magenta) and key residues at a contour level of 6σ. c, H2DIDS (magenta) binding mode. d, Cryo-EM density of H2DIDS (magenta) and key residues at a contour level of 5σ. e, f, DEPC modifications of K539 and K851 (e) and corresponding cryo-EM densities (f) shown at a contour level of 8σ. g, h, Binding pocket of apo structure (g) and cryo-EM densities of residues (h) at a contour level of 6σ shown for comparison. i, Cryo-EM density of Dipyridamole (magenta) and key lysines at a contour level of 6σ. AE1’s gate and core domains are shown in tv blue and palecyan, respectively, and cryo-EM densities are shown as marine colored mesh.
