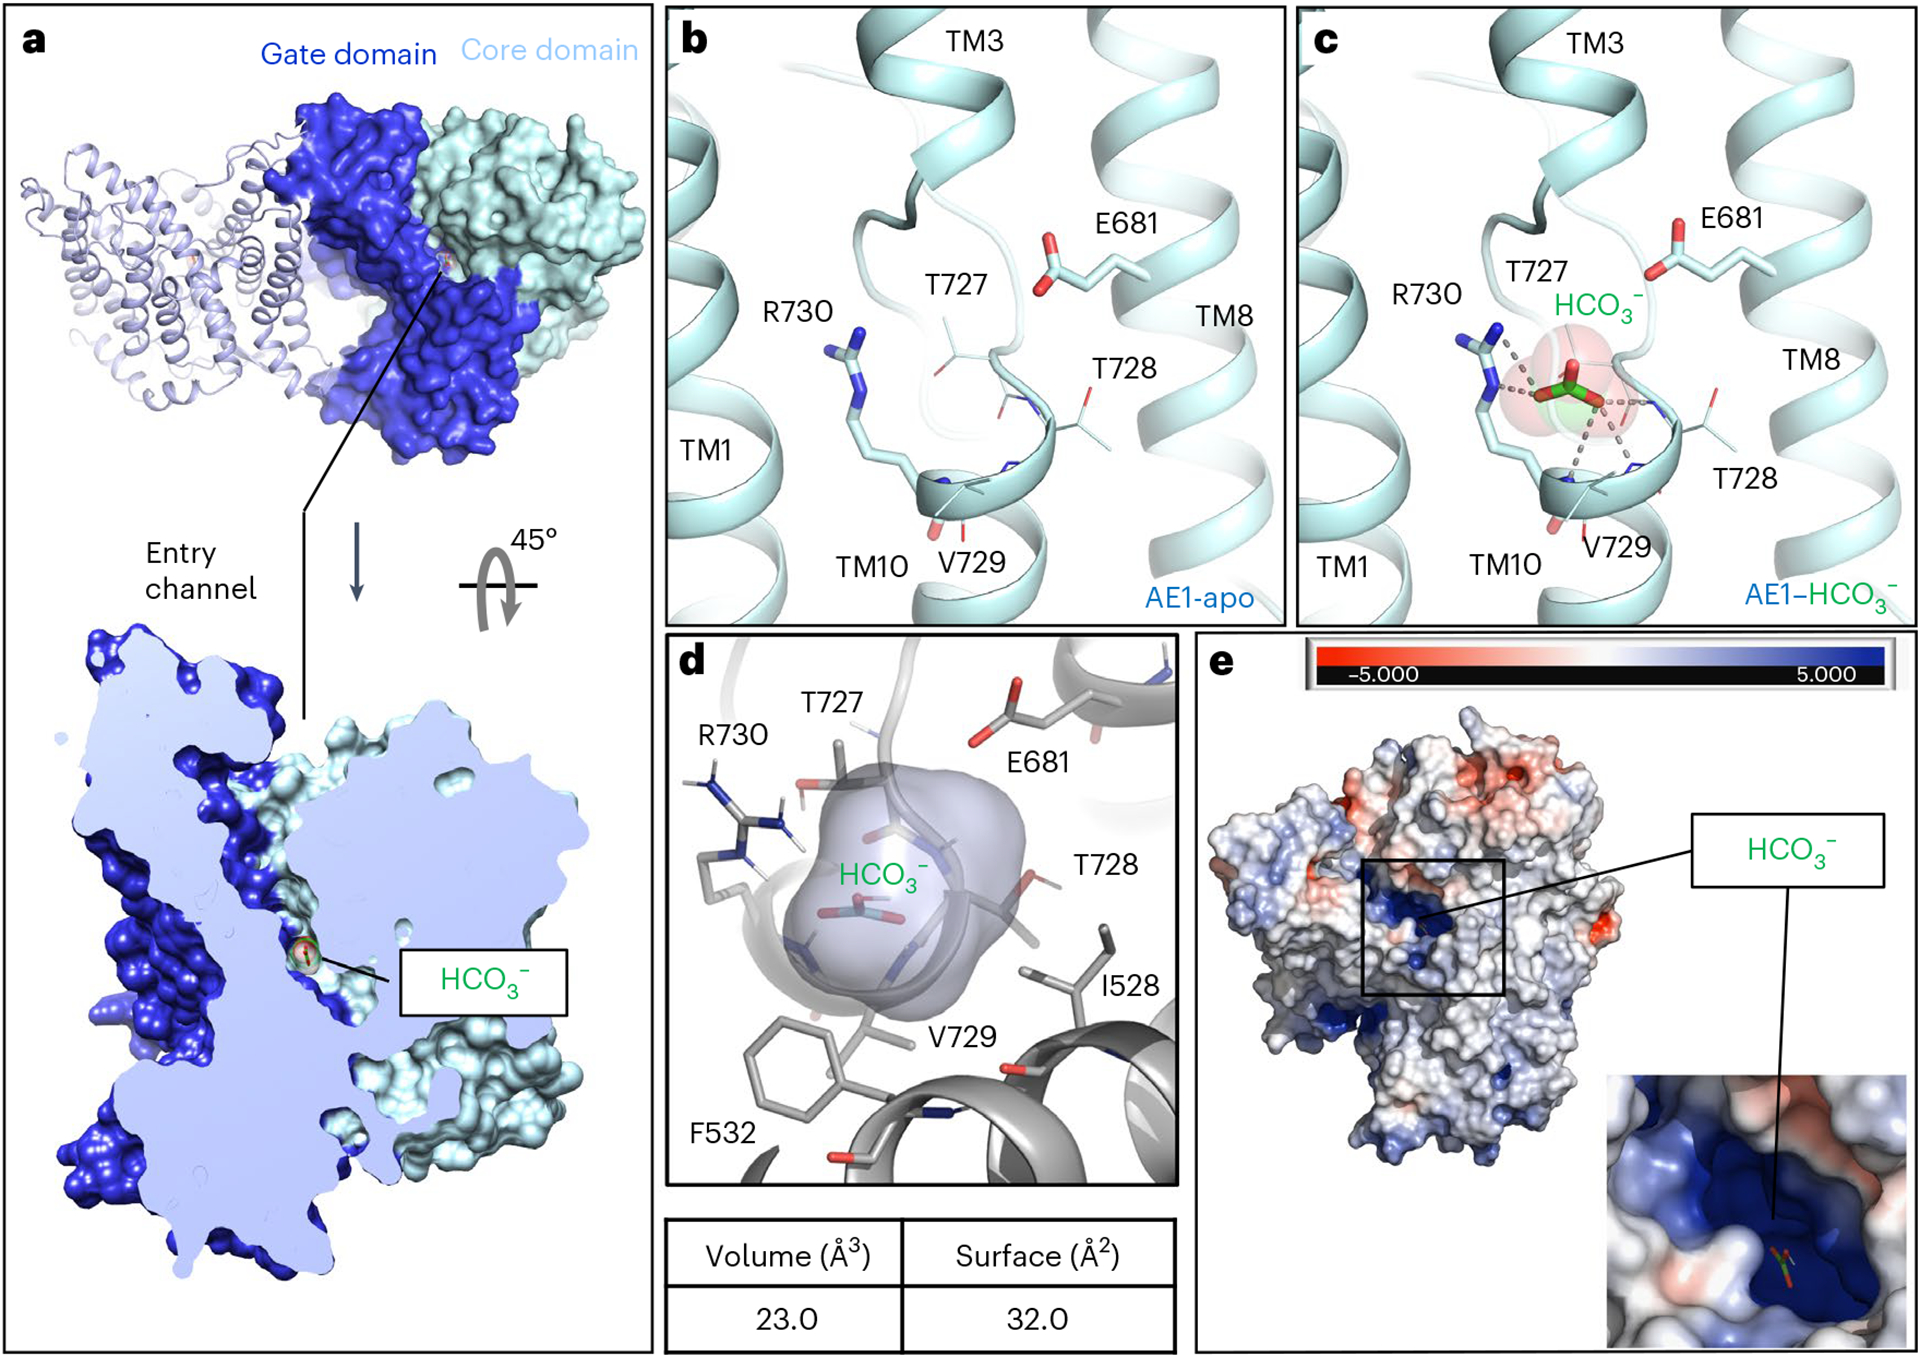
Fig. 2 |. Structural insight into bicarbonate binding at AE1.

a, Extracellular view of mdAE1 homodimer (top) and cut-site view of monomer (bottom). Gate and core domains are shown in dark blue and pale cyan, respectively, and bound bicarbonate is shown in green. b,c, Close-up of anion binding site in apo (b) and bicarbonate-bound (c) AE1 structures with highlighted key residues. d, Calculation of bicarbonate binding site volume and surface using POVME3 (ref. 56). e, Extracellular view of mdAE1 colored by charge distribution highlighting positively (blue) and negatively (red) charged surfaces.
