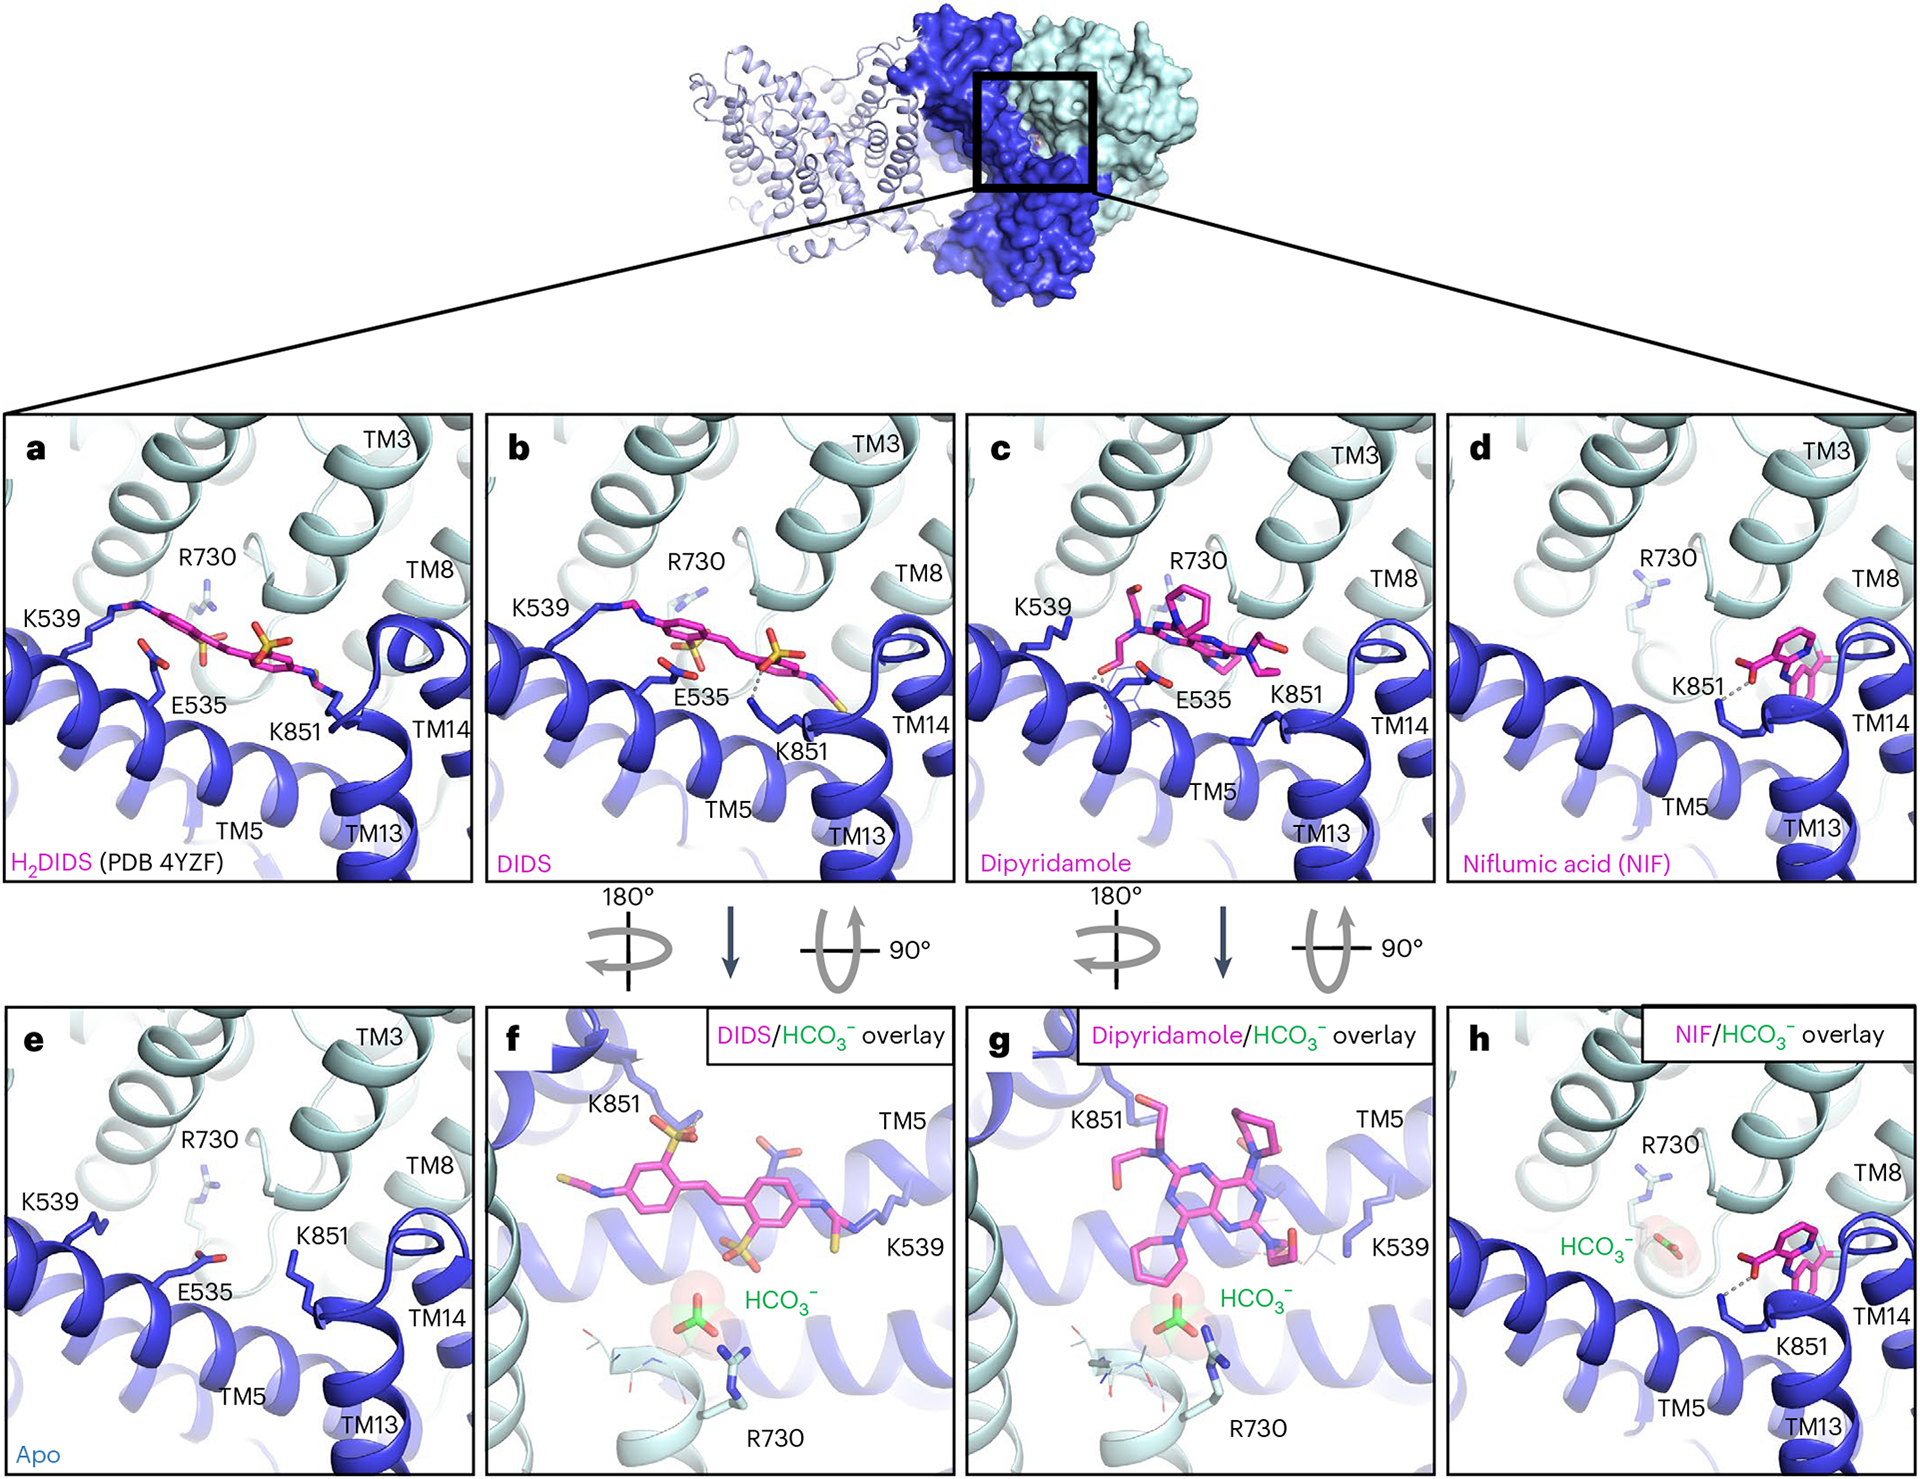
Fig. 3 |. Structure of AE1 bound to chemically and pharmacologically diverse inhibitors.

a, Previous mdAE1–H2DIDS crystal structure (PDB 4YZF)14 showing likely covalent binding of H2DIDS (magenta) to K539 and K851. b–e, Cryo-EM structures of AE1 bound to DIDS (b), dipyridamole (c), NIF (d) or apo state (e) reveal the binding location and pose of inhibitors (magenta). f–h, Overlay with bicarbonate-bound AE1 structure (green) shows that DIDS (f) and dipyridamole (g) restrict access to the anion binding site, while NIF (h) binds in a different location and leaves access to the anion binding site unobstructed. Ionic interactions and hydrogen bonds are shown as dotted lines. Gate and core domains are shown in dark blue and pale cyan, respectively.
