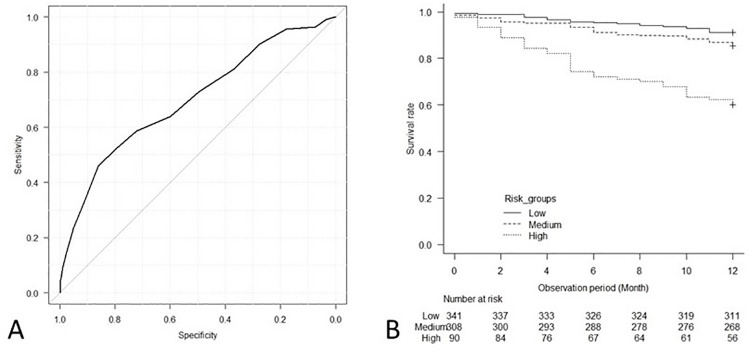
Fig 3.
The ROC curve of the prognostic risk score for the prediction of early death within 1 year (A), and association between risk groups and mortality in the internal validation cohort (B). (A) The prognostic risk score showed high accuracy for the prediction of the outcome in the internal validation cohort; c-statistics, 0.70 (95% CI, 0.64, 0.75). (B) The Kaplan-Meier survival curves show a significant difference in mortality between the risk groups (log-rank test, p<0.001).

