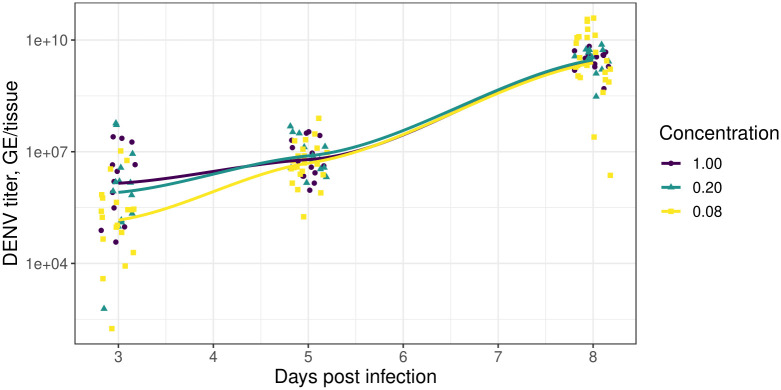
Fig 3. Blood meal dose affects initial midgut viral titers but not the ultimate viral levels.
The points indicate the raw experimental measurements of virus titer. The lines represent locally estimated scatterplot smoothing (LOESS) curves fit to the data using the default ggplot2 specifications [54]. The colouring corresponds to the concentration of the infected blood meal relative to the highest dose used. The points have horizontal jitter added to them.

