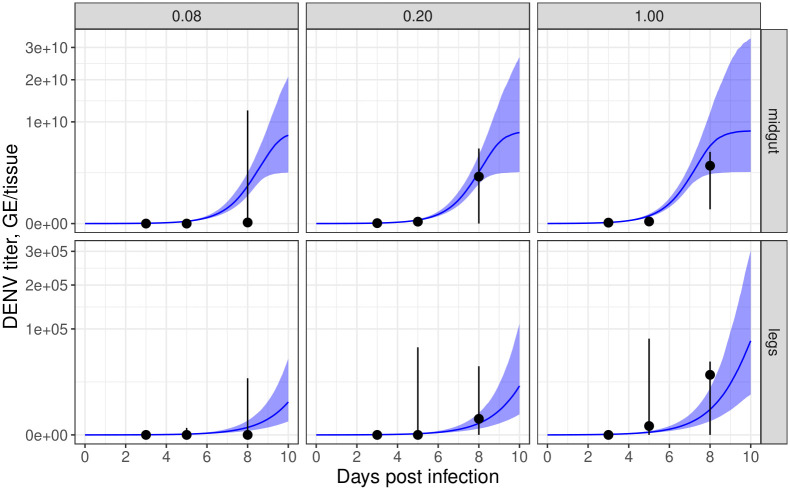
Fig 4. Blood meal dose affects the time-profile of midgut and leg infection titers.
The top / bottom rows correspond to midgut / leg infection; the panels correspond to relative initial blood meal dose. The blue lines and ribbons indicate modelled results (lines correspond to posterior predictive median simulations of the modelled mean; ribbons to 2.5%-97.5% posterior quantiles in the modelled mean). The black points and whiskers indicate the raw experimental data (points correspond to medians; whiskers to 10%-90% quantiles).

