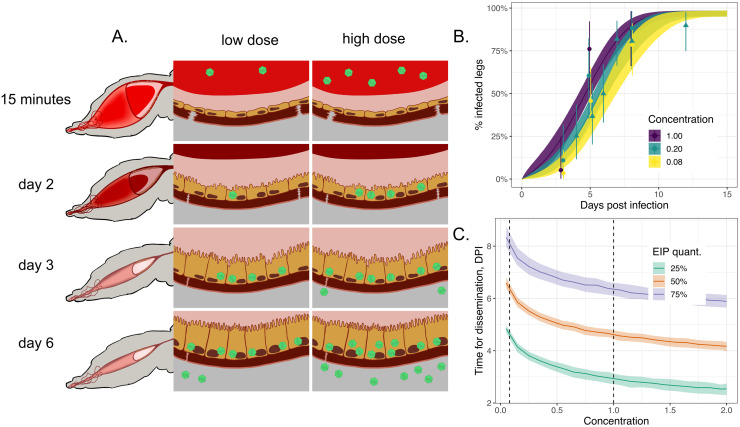
Fig 5. Blood meal dose affects the timing of dissemination.
Panel A shows a schematic of two mosquito midguts over the initial course of infection (virus particles shown in green): the left-hand sequence of images corresponds to a mosquito fed on a low dose of virus; the right-hand sequence, to a mosquito fed on a high dose. Panel B shows the positivity of legs conditional on successful midgut infection as a function of concentration (colouring). Points / triangles show the posterior medians for each experimental data point for the continuous / dichotomous experiments and the ranges show 2.5%-97.5% posterior quantiles assuming a beta prior on positivity. Panel C shows how the modelled time taken to reach 25%, 50% and 75% disseminated infection is affected by blood meal dose; the vertical dashed lines delimit the range of experimental infection doses explored (i.e. anything outside the range is extrapolative). In both panels, the lines show posterior median model simulations, and the shading shows the posterior 2.5%-97.5% posterior modelled quantiles. In panel B, the modelled % infected legs values were determined by calculating the probability the titer exceeds the detection threshold, specified by Eq (11).

