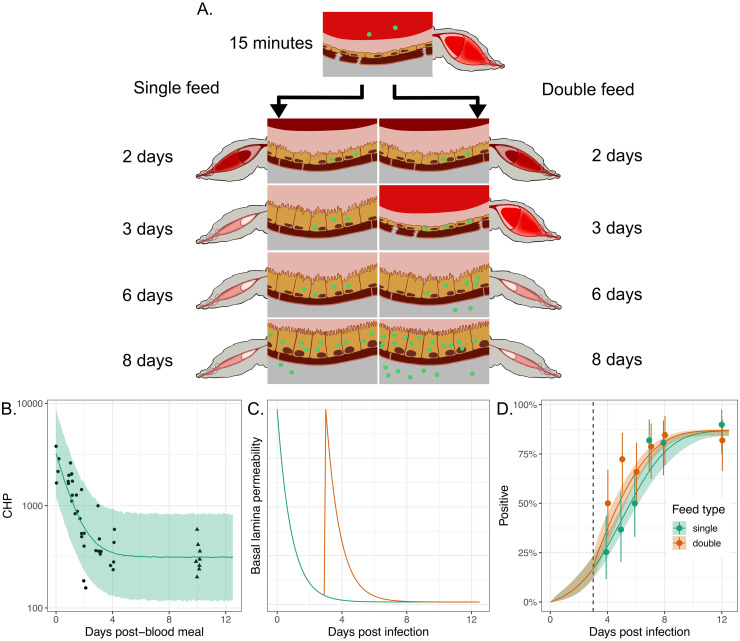
Fig 6. Transient basal lamina permeability following a blood meal can explain earlier dissemination in mosquitoes taking successive blood meals.
Panel A shows a schematic of viral invasion of the midgut epithelium layer with virus particles shown in green. The left-hand sequence of images corresponds to a mosquito bloodfed once, on day 0. The right-hand sequences corresponds to a mosquito fed once on day 0 and again on 3 days post the initial bloodfeed; this second feed leads to tears in the basal lamina leading to more rapid viral escape from the midgut layer. Panel B shows data (points and triangles) from experiments where CHP, a measure of damage in the basal lamina layer, was measured post a blood feed at time 0 (see Methods). The points represent observations taken at the times indicated; the triangles represent observations taken on unfed mosquitoes, here assumed to proxy for the level of CHP 10 days post-blood meal (DPBM). The green line and uncertainty ribbons (2.5%-97.5% posterior quantiles) show the model fits to the data. Panel C shows the modelled basal lamina integrity (measured by x(t) in Eq (2)) for single- (green line) or double-fed (orange line) mosquitoes, where the second feed occurs 3 DPI. These lines represent posterior median simulations. Panel D shows the proportion of infected legs indicating dissemination infection for either single- or double-fed mosquitoes, where the second feed occurs 3 DPI (dashed line). The points show the experimental data, and the solid lines (posterior medians) and ribbons (2.5%-97.5% posterior quantiles) show model simulations. The solid points indicate the posterior median proportions, and the whiskers indicate the 2.5%-97.5% posterior quantiles, assuming a uniform prior on the proportion. In panel D, the modelled % infected legs values were determined by calculating the probability the titer exceeds the detection threshold, specified by Eq (8).

