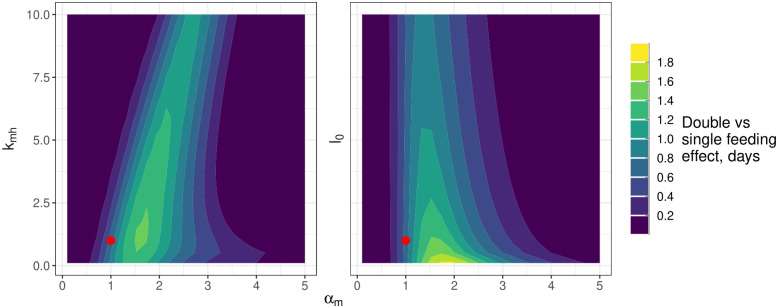
Fig 7. The dependence of the double feed effect on the midgut viral proliferation rate (αm), the rate of escape from the midgut (kmh) and the initial bloodmeal titer (l0).
The colouring indicates the difference in the time taken to reach a midpoint in viral dissemination for double versus single feeding: lighter colours indicate a faster rate of dissemination for double feeding. The axes show the multiples of the posterior mean estimates of each of the parameters used for the simulations. The red point indicates the double feeding effect estimated at the posterior mean parameter values. Note, that the simulations were performed and gridded values of each parameter and the resultant heatmap has been smoothed using the default options of the geom_contour_filled option in the ggplot2 package [54].

