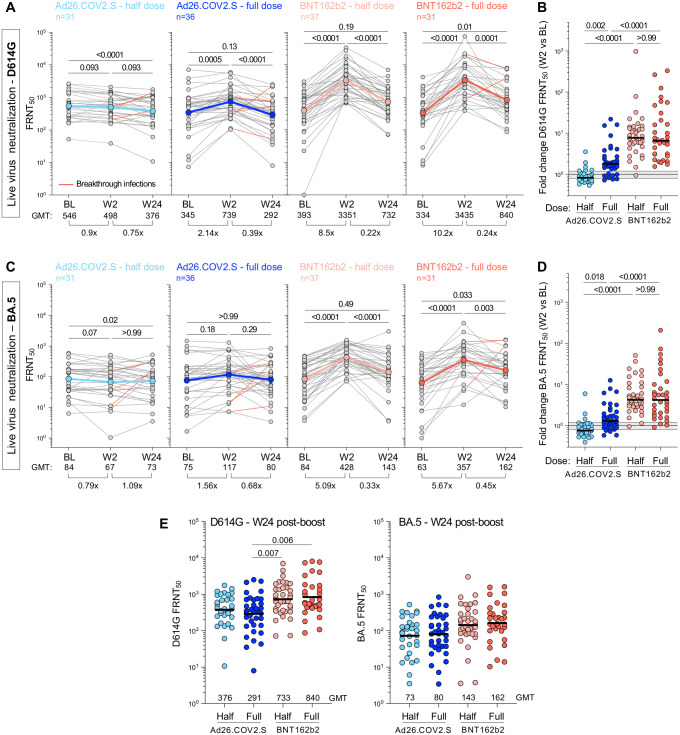
Fig 4. Live-virus neutralization activity against ancestral D614G and BA.5 SARS-CoV-2 variant after booster vaccination.
Neutralizing titer (FRNT50) against ancestral D614G (A&B) and Omicron BA.5 (C&D) at BL and post-vaccine booster. A&C show titer at BL, W2 and W24 post-boost for D614G (A) and BA.5 (C). Fold-change of the GMT is indicated at the bottom of each graph. The color-coded dots and bold lines represent the GMT at each time point. Recorded BTI between W2 and W24 are depicted with red lines. Statistical comparisons were performed using a Friedman test with Dunn’s correction. B&D show fold-change in neutralizing titer against D614G (B) and BA.5 (D) between BL and W2 in each study arm. Bars represent median fold-change. A Kruskal-Wallis test with Dunn’s correction was used to compare different arm groups. (E) Comparison of the neutralizing titer (FRNT50) against D614G (left panel) and BA.5 (right panel) between study arms at W24. Bars represent GMT. Statistical comparisons were performed using a Kruskal-Wallis test with Dunn’s correction.

