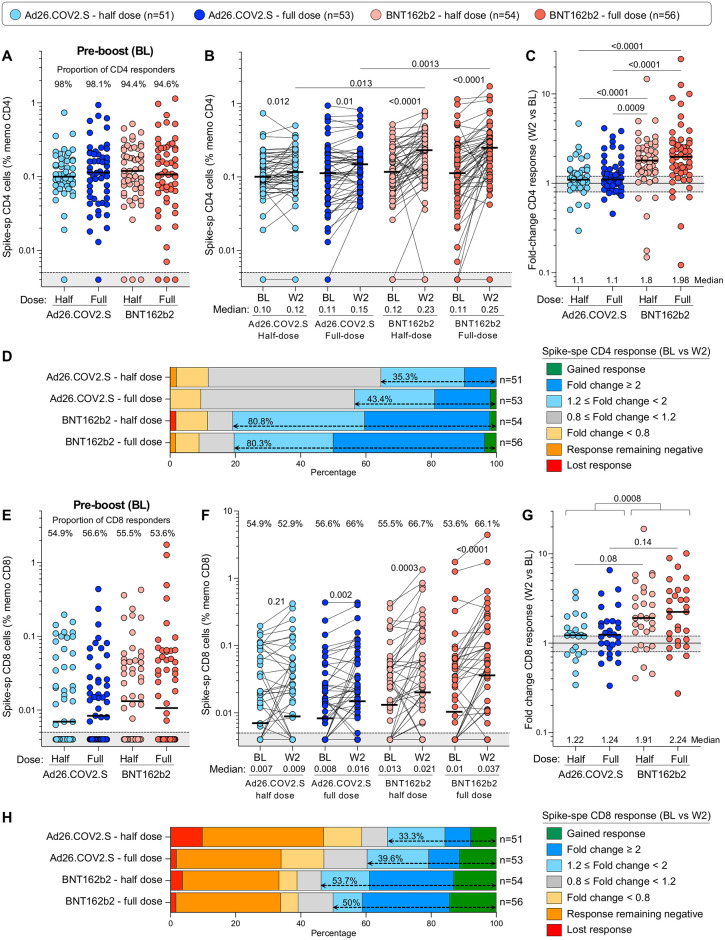
Fig 7. SARS-CoV-2 spike-specific T-cell responses before and 2 weeks after vaccine boosting.
(A) Comparison of the frequency of spike-specific CD4+ T cells pre-boost in the four study arms. The grey shaded area indicates undetectable response. (B) Frequency of spike-specific CD4+ T cells before (BL) and after vaccine boost (W2). (C) Fold change in the frequency of spike-specific CD4+ T cells between W2 and BL. (D) Overall profile of the evolution of the spike-specific CD4+ T-cell response between BL and W2. (E) Comparison of the frequency of spike-specific CD8+ T cells pre-boost in the four trial arms. (F) Frequency of spike-specific CD8+ T cells before (BL) and after vaccine boost (W2). (G) Fold change in the frequency of spike-specific CD8+ T cells between W2 and BL. (H) Overall profile of the evolution of the spike-specific CD8+ T-cell response between BL and W2. Bars represent medians. A two-tailed Wilcoxon signed-rank test was used to assess statistical differences between paired samples and a Kruskal-Wallis with Dunn’s corrections was used to compare different groups.

