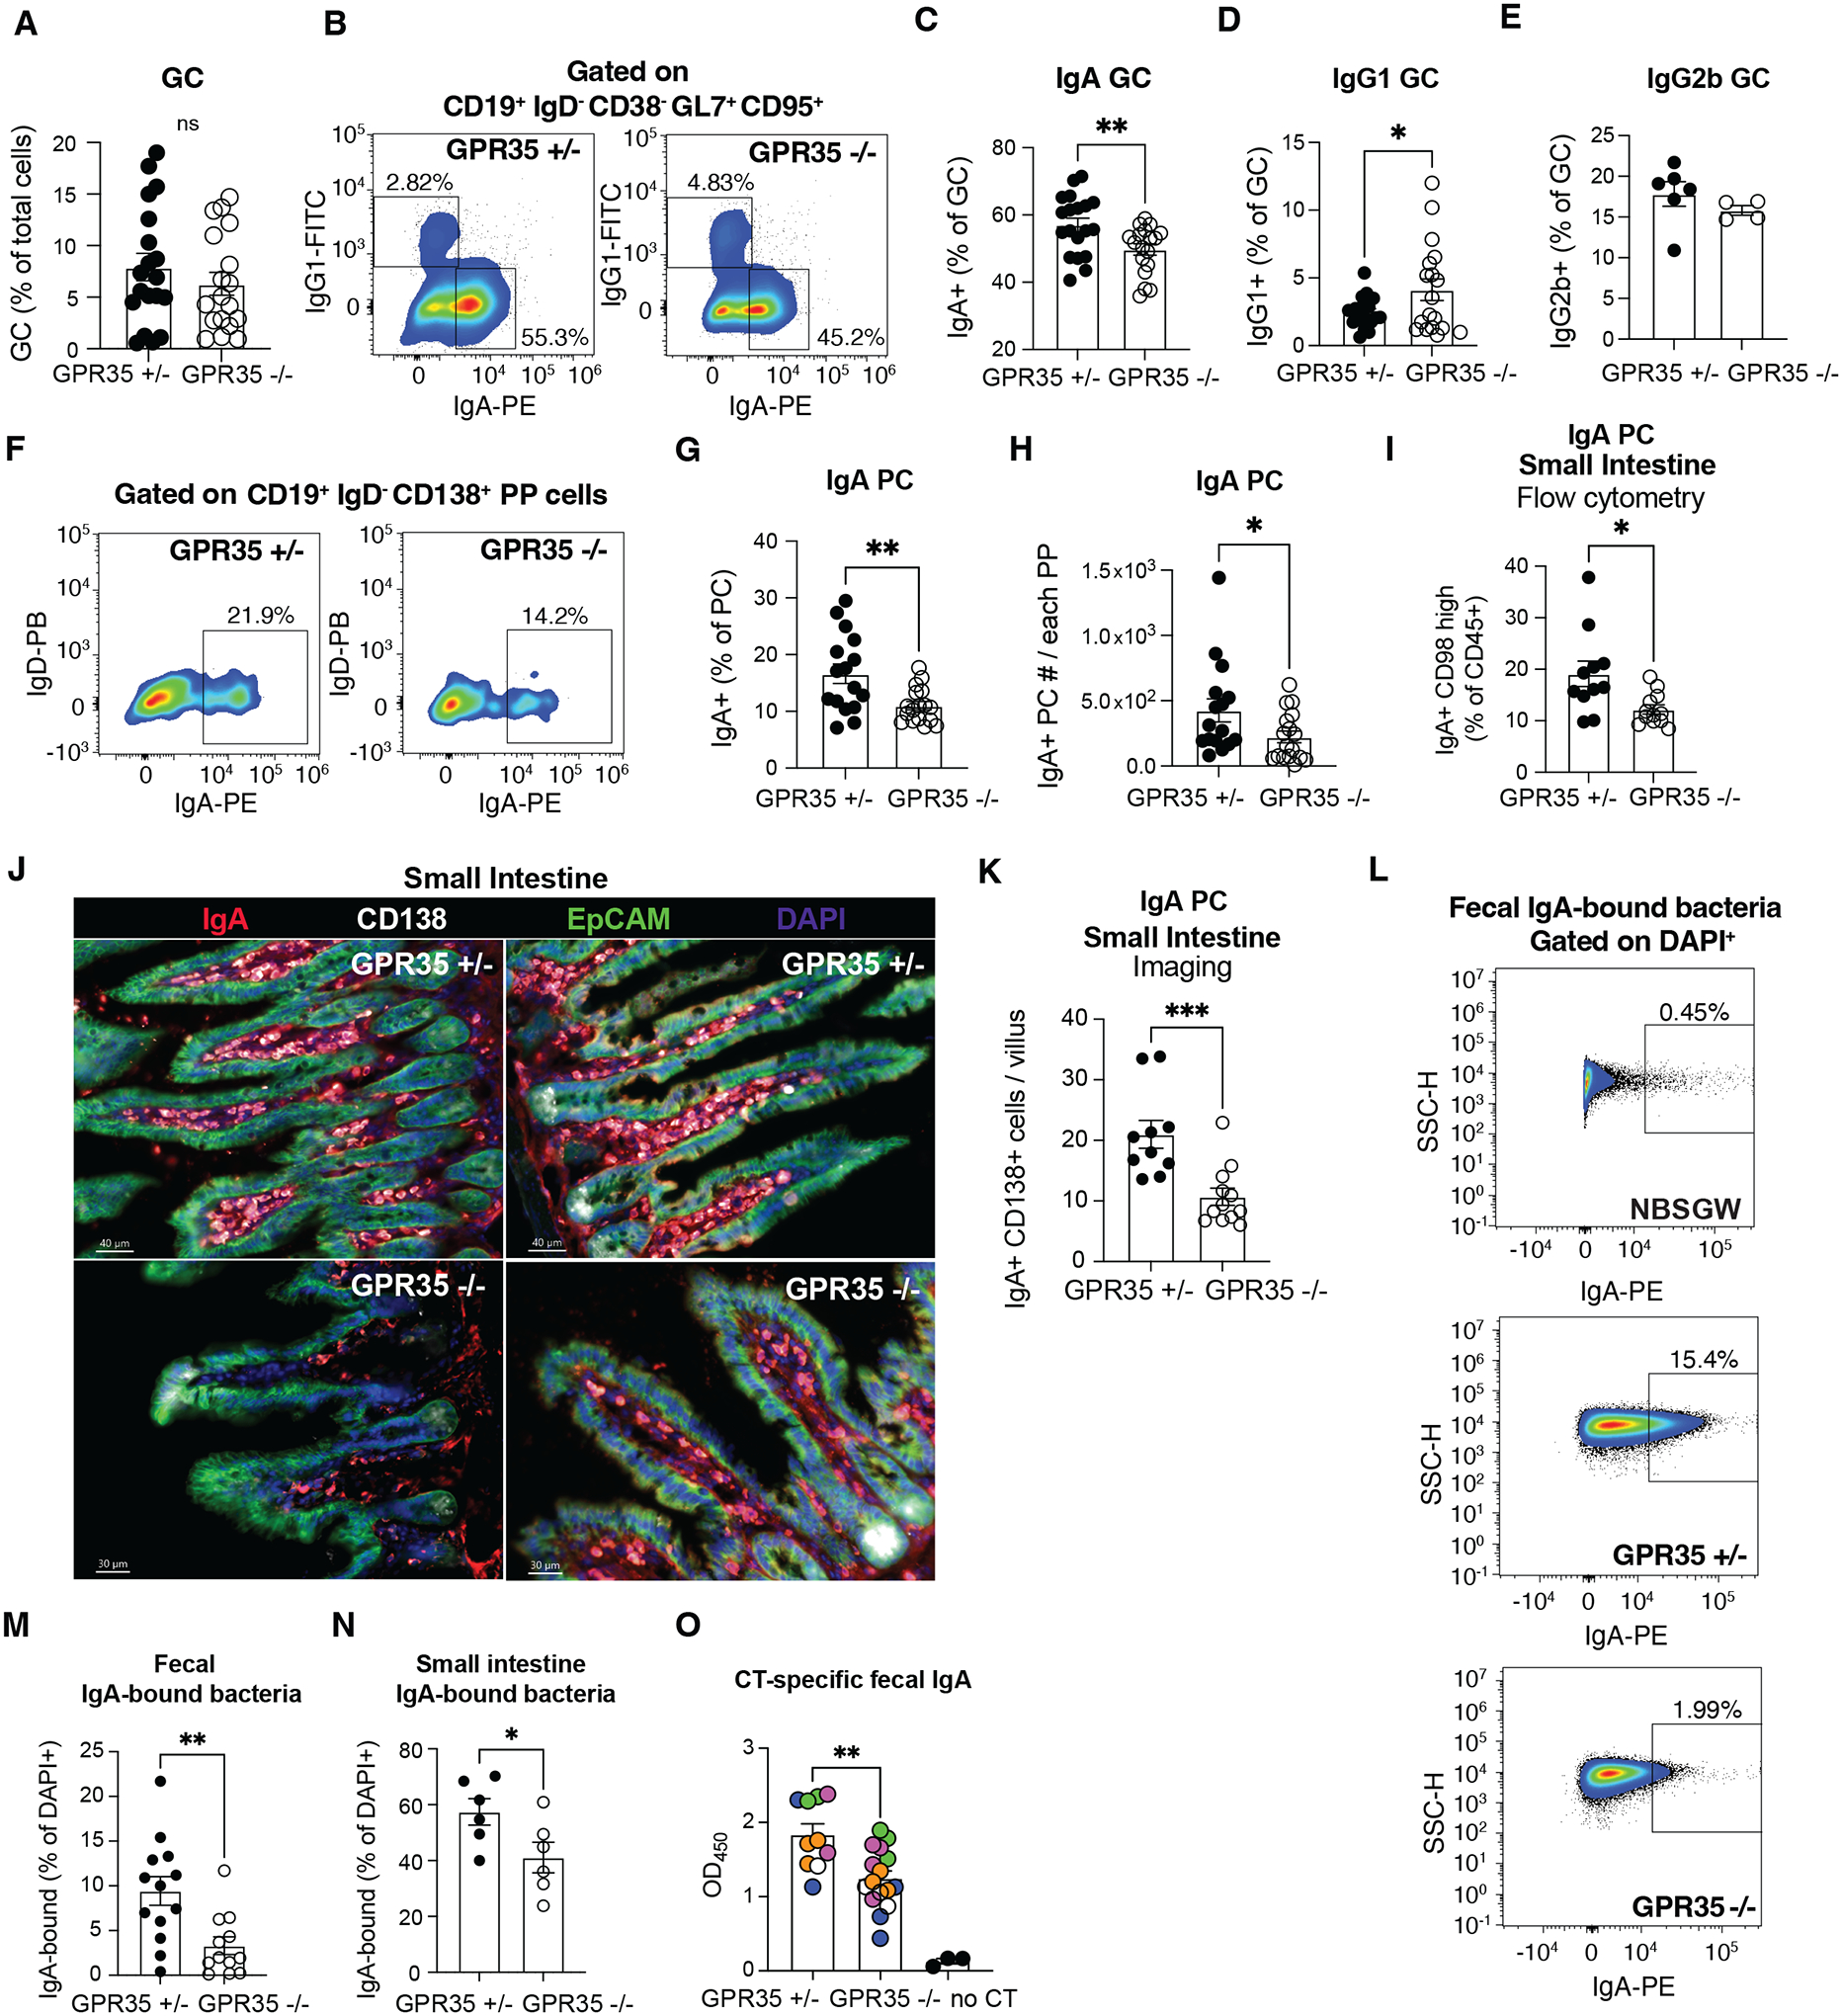
Figure 3. GPR35 supports intestinal IgA B cell responses.

A. Quantification of GC cells % (CD19+ IgD− CD38− Gl7+ CD95+ out of total cells) in PPs from control (GPR35+/−) and GPR35−/− mice using indicated markers. B. Flow cytometry plots showing % of IgA+ and IgG1+ GC B cells. C-E. Summary graphs showing % GC B cells that were IgA+ (C) IgG1+ (D) or IgG2b+ (E) in PPs from GPR35+/− and GPR35−/− mice. n=19 (GPR35+/− A, C, D); n=18 (GPR35−/−, A, C, D); n=6 (GPR35+/−, E), n=4 (GPR35−/−, E). Data are pooled from 4 (A, C, D) or 2 (E) independent experiments. F. Representative flow cytometry plots showing % of IgA+ (out of CD19+ IgD− CD138+ plasma cells). G, H. Quantification of IgA+ % (out of CD19+ IgD− CD138+ plasma cells, G) and absolute numbers (H) of IgA+ plasma cells in PPs from GPR35+/− and GPR35−/− mice using gating as in F. n=16 (Gpr35+/−, G, H); n=17 (GPR35−/−, G, H). Data are pooled from 4 independent experiments. I-K. Quantification of IgA+ CD98 high plasma cell % (out of CD45+) by flow cytometry (I) and of IgA+ CD138+ plasma cells quantification by imaging (J, K) in the small intestine of GPR35+/− and GPR35−/− mice. (J) Shows two representative epifluorescence images of data quantified in (K) of small intestinal villi from GPR35+/− (upper) and GPR35−/− (lower) mice. IgA (red), CD138 (white), EpCAM (green) and DAPI (blue) staining are shown. n=10 (GPR35+/−, I, K); n=12 (GPR35−/−, I, K). L. Representative flow cytometry plots showing % (out of DAPI+) of IgA-bound fecal bacteria from lymphocyte-deficient NBSGW (negative control, top), GPR35+/− (middle) or GPR35−/− (bottom) mice. N-M. Quantification of IgA-bound fecal (M) or small intestine (N) bacteria in GPR35+/− and GPR35−/− mice. n=13 (GPR35+/−, M); n=12 (GPR35−/−, M); n=6 (GPR35+/− and GPR35−/−, N). Data are pooled from 3 (M) or 2 (N) independent experiments. Data are representative of 3 independent experiments. * p<0.05; ** p<0.005; *** p<0.0005. Data are presented as mean ± SEM. Two-tailed unpaired t-tests were performed.
