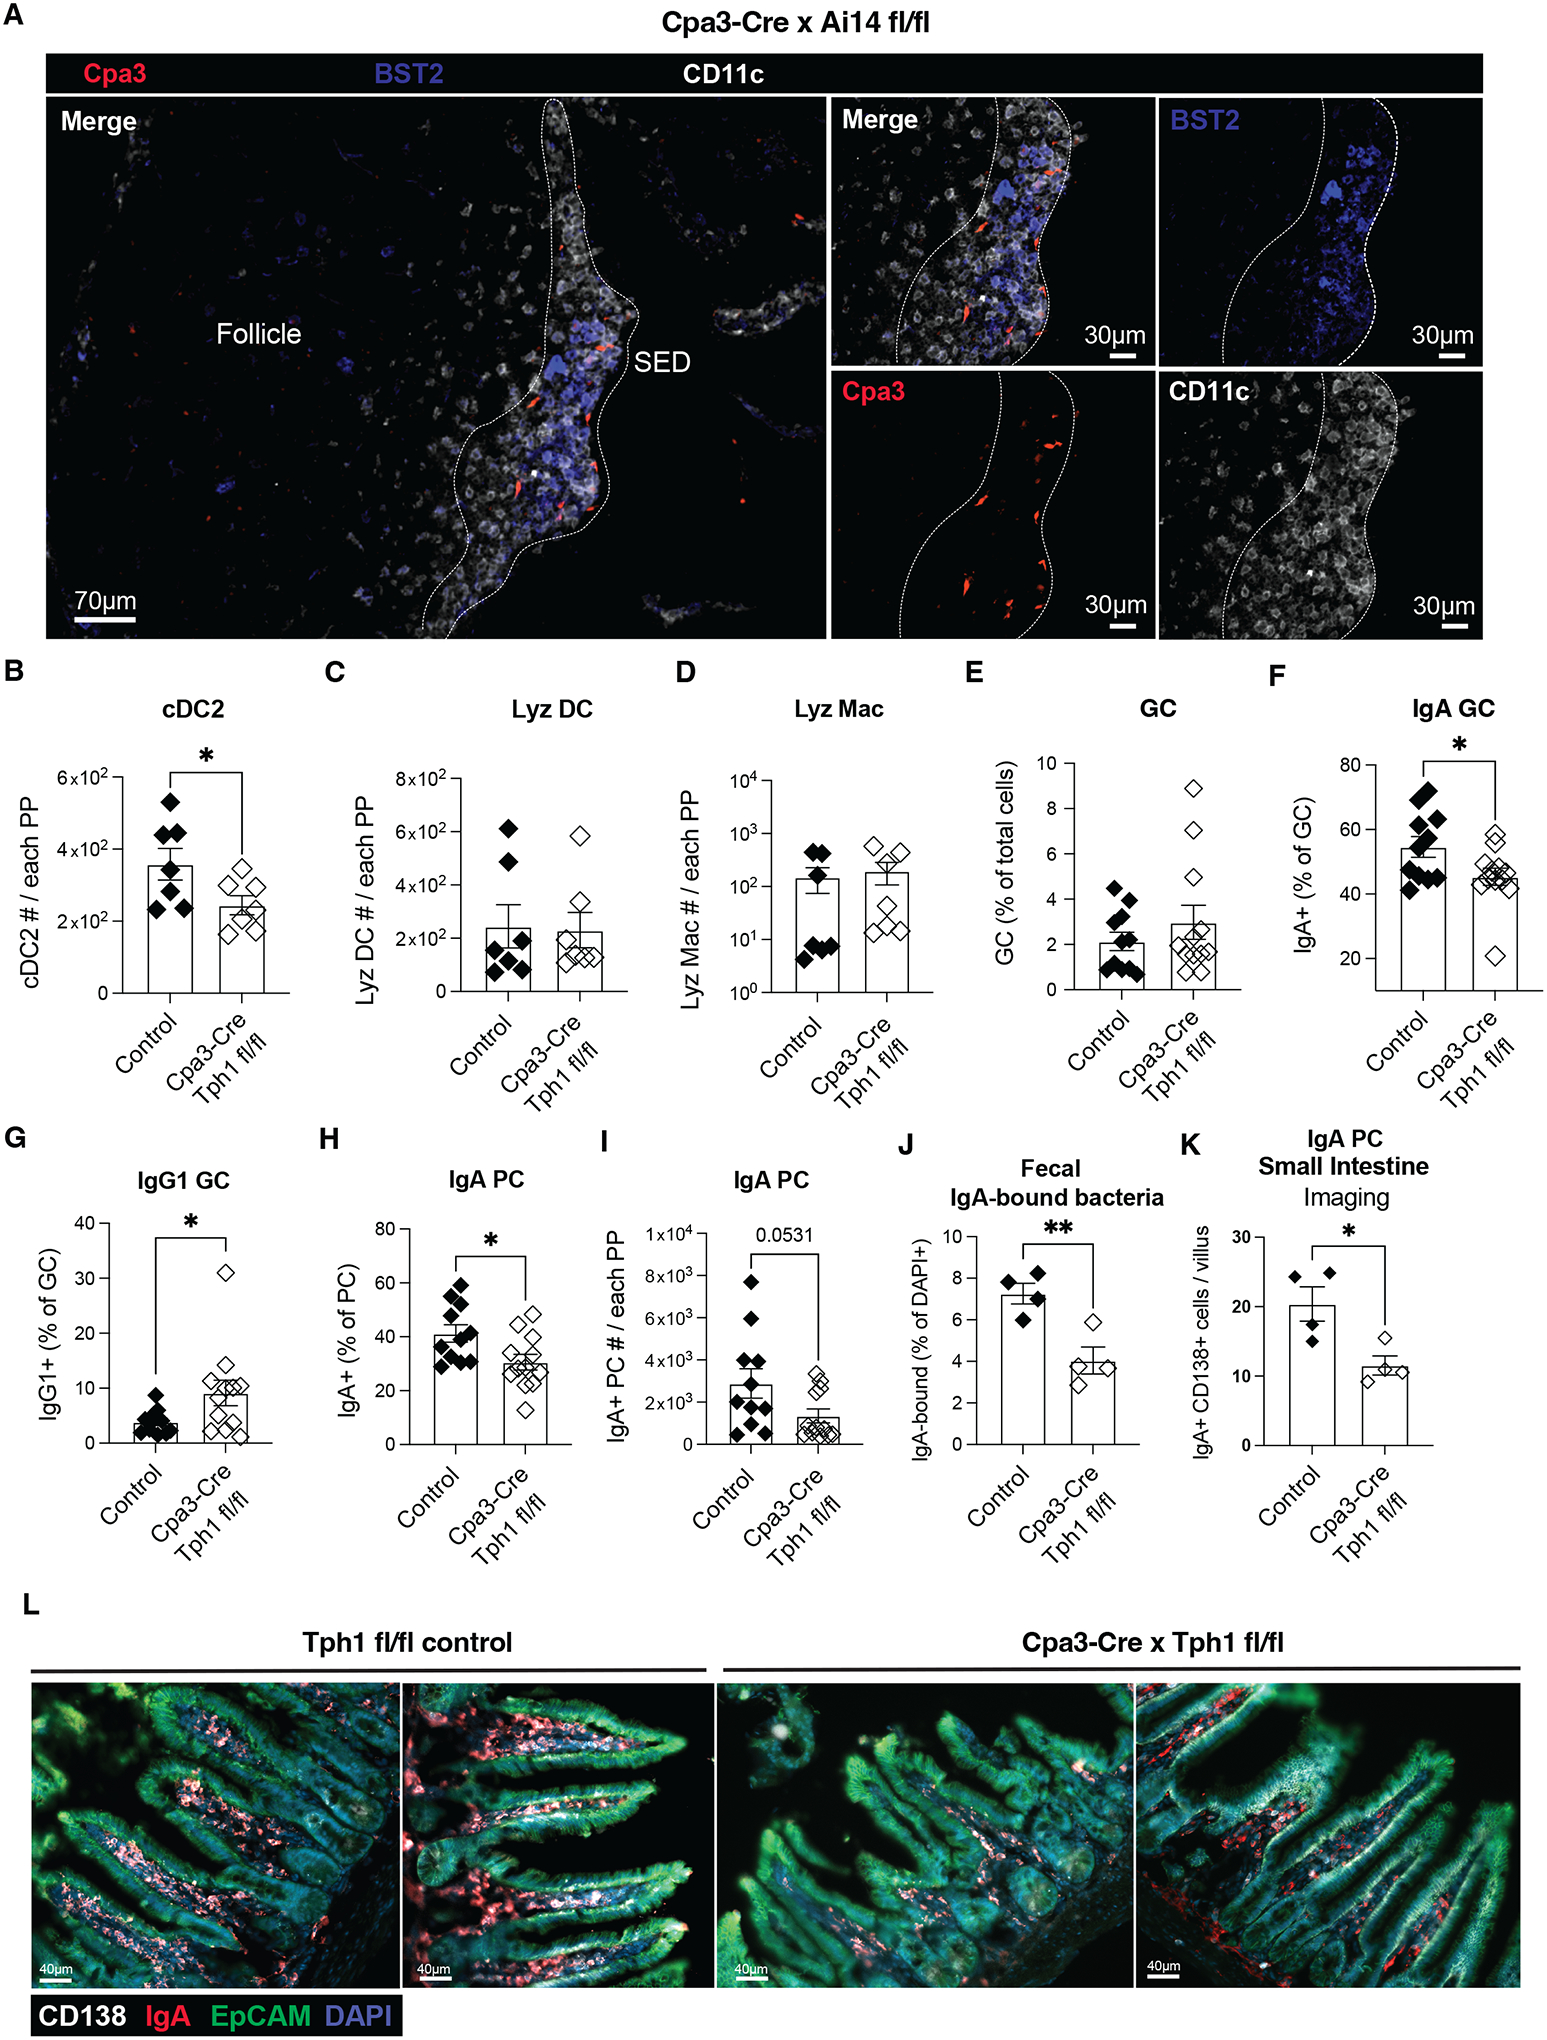
Figure 4. Mast cell-derived serotonin metabolite(s) support cDC2 maintenance and localization within SED to boost intestinal IgA responses.

A. Epifluorescence micrographs of PPs from Cpa3-Cre × Ai14fl/fl (mast cell reporter) mice. Cpa3 (red), BST2 (blue) and CD11c (white) signals and staining are shown. The white dashed lined delimits the SED and was depicted based on CD11c positivity. Images are representative of at least 4 mice and 2 independent experiments. B-D. Quantification of cDC2 (B), Lyz DC (C) and Lyz Mac (D) absolute numbers in PPs from control (Cpa3-Cre Tph1fl/wt and Tph1fl/fl) and Cpa3-Cre Tph1fl/fl mice. n=7. Data are pooled from 2 independent experiments. E-J. Quantification of (E) GC cells % (CD19+IgD−CD38−GL7+CD95+ out of total cells), (F) IgA+ GC cell % and (G) IgG1+ GC cell % (out of CD19+ GL7+ CD95+ CD38− IgD−), (H) IgA+ plasma cells % (out of CD19+ IgD− CD138+), (I) IgA+ plasma cells numbers, and (J) IgA-bound fecal bacteria % (out of DAPI+) in control (Cpa3-Cre Tph1fl/wt and Tph1fl/fl) and Cpa3-Cre Tph1fl/fl mice. n=11 (control, E-I); n=4 (control, J); n=12 (Cpa3-Cre × Tph1fl/fl, E-I); n=4 (Cpa3-Cre × Tph1fl/fl, L). Data are pooled from 3 (E-I) or 2 (J) independent experiments. Data are representative of 3 independent experiments. K, L. Quantification (K) of CD138+ IgA+ plasma cells per villus in images (L) from Tph1fl/fl control (two examples, left) and Tph1fl/fl Cpa3-Cre (two examples, right) mice. n=12. Data are pooled from 2 independent experiments. * p<0.05; ** p<0.005; *** p<0.0005. Data are presented as mean ± SEM. Two-tailed unpaired t-tests were performed.
