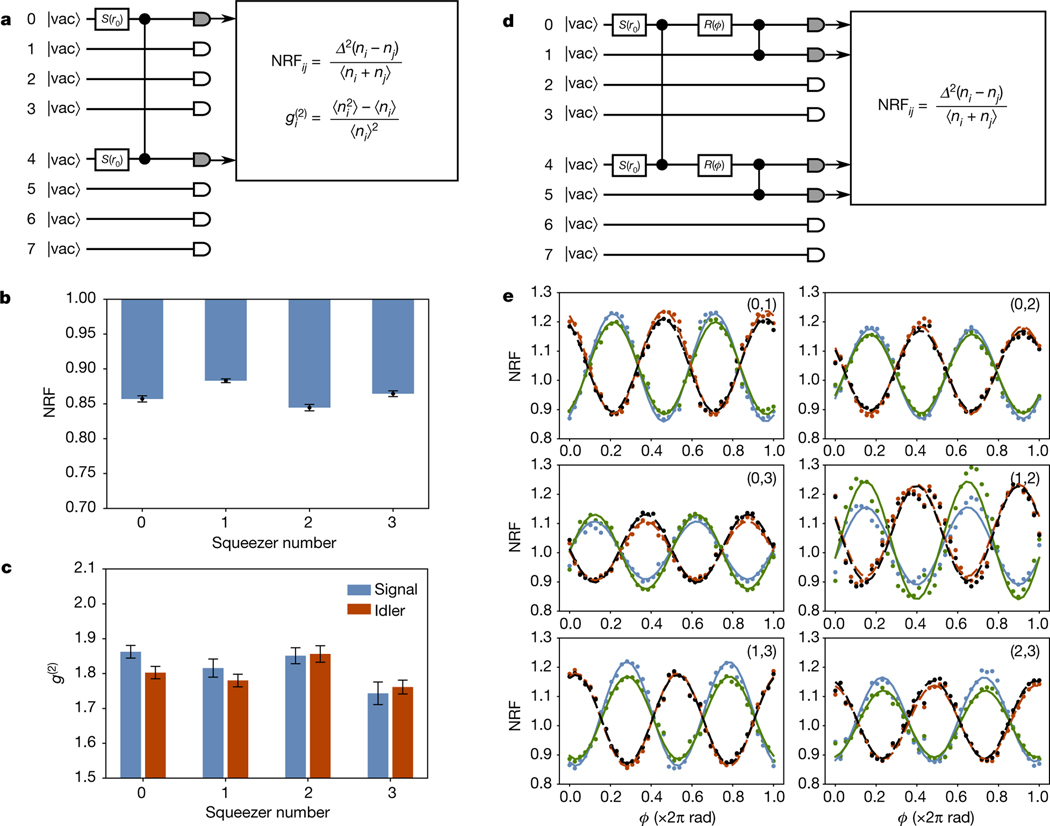
Fig. 2 |. Component statistics.
a, Schematic of the circuit used to measure NRFs and second-order correlation statistics for individual squeezers, here illustrated for squeezer 0. The unitary is set to the identity transformation, and each squeezer is turned on individually. Photon samples collected from the corresponding signal and idler outputs are collected and used to calculate the relevant quantities. b, Raw NRF for each of the squeezers. Each is well below unity, indicating non-classicality. Error bars represent one standard deviation over eight batches of 105 samples. c, Raw measured unheralded second-order correlation statistic of the signal and idler for each squeezer. Each is close to , indicating nearly single-temporal-mode operation. Error bars represent one standard deviation over eight batches of 105 samples. d, Schematic of the circuit used to measure quantum interference between pairs of squeezers. Here the circuit for the (0,1) pair is illustrated: two squeezers are turned on, and the interferometer is used to interfere their outputs on an effective 50/50 beam splitter with relative input phase , implemented by the single-mode rotation . The NRFs are then calculated from the photon-number samples. e, Interference traces between pairs of squeezers. The six panels each correspond to a different squeezer pair . Within each panel, four NRFs are plotted as function of the relative phase : [signal 1 – idler 1] (blue), [signal 2 – idler 2] (green), [signal 1 – idler 2] (red), [signal 2 – idler 1] (black). Points correspond to raw, uncorrected measured data; solid and dashed lines are best fits (least squares) to a model that incorporates no imperfections except photon loss.

