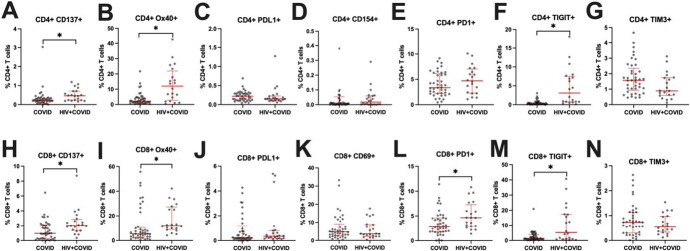
FIGURE 2.
T-cell expression of activation and exhaustion markers. A–G, Frequencies of CD4+ T cells expressing activation markers CD137, OX40, PDL1, or CD154 or exhaustion markers PD1, TIGIT, or TIM3. H–N, Frequencies of CD8+ T cells expressing activation markers CD137, OX40, PDL1, or CD69 or exhaustion markers PD1, TIGIT, or TIM3. COVID—PWOH experiencing acute COVID-19. HIV + COVID—HIV-positive participants experiencing acute COVID-19. Red bars denote median and interquartile range. P values determined by Mann–Whitney U test. *P ≤ 0.05.

