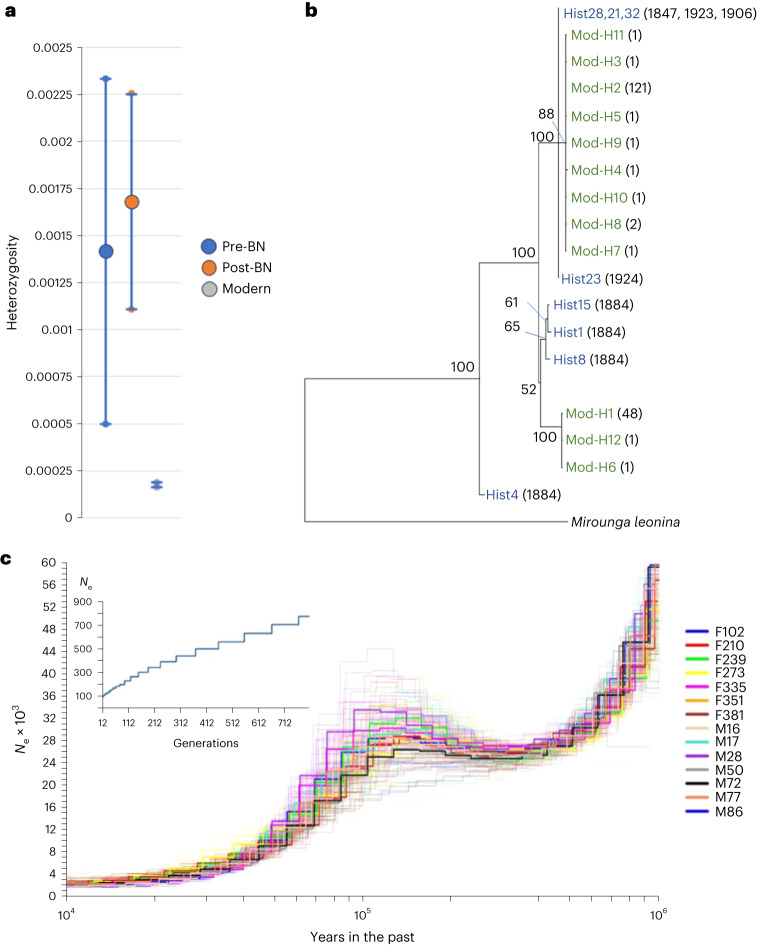
Fig. 1. Diversity and demographics.
a, Mean (±1 s.d.) nuclear heterozygosity for pre (N = 5), immediately post (1906–1923; N = 3) bottleneck (BN) and modern genomes (N = 180). b, Mitogenome DNA neighbour-joining tree comparing historical (blue) and modern (green) haplotypes for all historical and all modern adult samples. For the historical samples (Hist), numbers in brackets indicate dates; for the modern samples, numbers in brackets indicate the numbers of individuals with a given haplotype. Bootstrap values reflect proportional support (%) out of 1,000 replicates. c, PSMC plot for 14 modern samples showing historical demography (pale lines showing bootstrap replicates). Inset: effective population size (Ne) estimate based on linkage disequilibrium.

