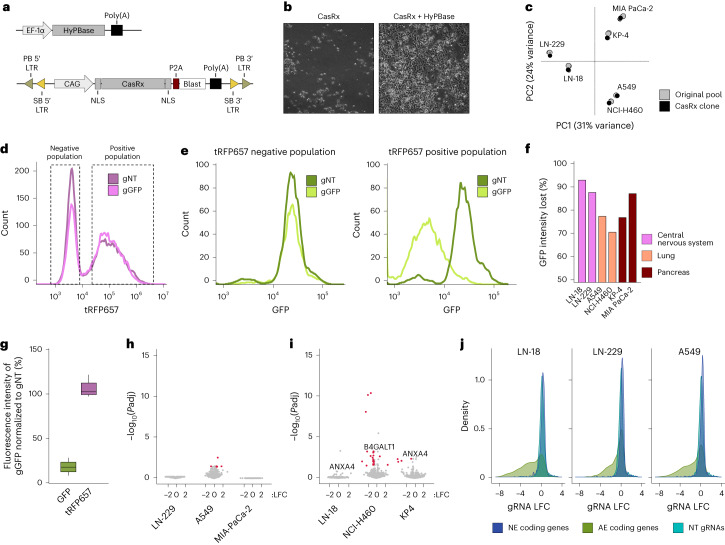
Fig. 1. Optimization of a genome-integrated CasRx system.
a, Schematic representation of the episomal HyPBase transposase and the transposon vectors used to deliver CasRx into mammalian cells. b, Representative brightfield microscope images of KP-4 cells 2 weeks after blasticidin selection. The puromycin control was performed once in each of the six generated cell lines. c, PCA plot of the 10% most variable genes using RNA-seq data from parental cell lines and derivative CasRx clones used in this study. d, tRFP657 intensity measured by flow cytometry in KP-4 cells, stably expressing GFP, transduced with a NT gRNA (gNT) or a GPF-targeting gRNA (gGFP). Dashed boxes indicate the extent of the negative and positive populations. e, GFP intensity measured by flow cytometry in the same cells as in d. Left panel, GFP intensity distribution of the tRFP657 negative cells; right panel, GFP intensity distribution of the tRFP657 positive cells. f, Percentage of CasRx activity in different cells. g, Boxplot showing the percentage of GFP or tRFP intensity between GFP-tRFP-positive cells transduced with a gGFP gRNA and cells transduced with a gNT gRNA. The experiments were performed in all the CasRx cell lines used for screens; n = 6 independent cell lines. Boxplot data is presented as follows: center, median; box bounds, 25% and 75% percentile; whisker, 1.5× interquartile range (IQR). Outliers are marked as independent dots. h, Lack of global gene dysregulation upon on-target cleavage of stably expressed GFP. Volcano plots display whole-transcriptome data for indicated CasRx clones transduced with gGFP or gNT. i, Lack of global gene dysregulation upon on-target cleavage of endogenous transcripts. Volcano plots display whole-transcriptome data for indicated CasRx clones transduced with gRNAs targeting indicated protein-coding genes or gNT. P values were computed with DESeq2 using the Wald test, and the FDR adjusted P value (Padj) was calculated with the Benjamini–Hochberg method. j, LFC distribution of gRNAs for three screens performed using a CasRx control library. The library is composed of gRNAs targeting NE expressed coding genes (dark blue), NT gRNAs (light blue) and gRNAs targeting AE coding genes (green). Blast, blasticidin; LTR, long terminal repeats; PB, PiggyBac; SB, Sleeping Beauty.

