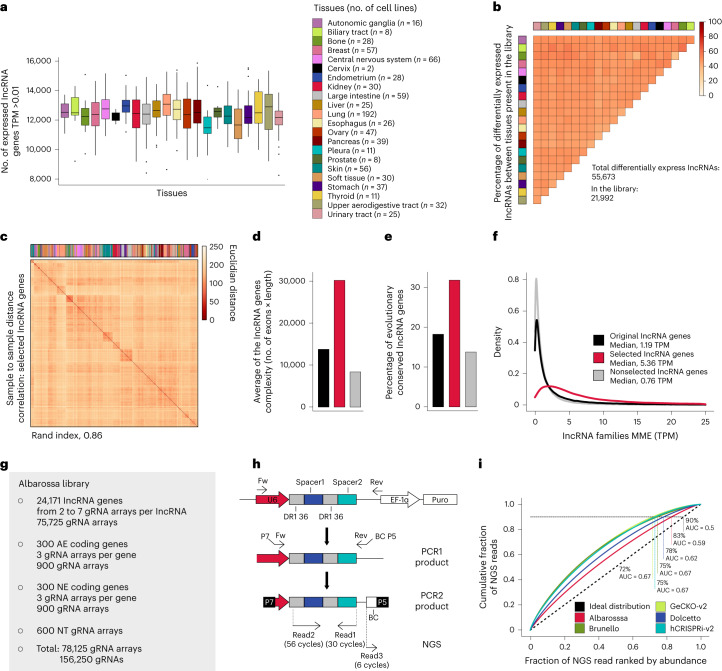
Fig. 3. Albarossa library displays high cross-cancer coverage and captures interentity lncRNA transcriptional heterogeneity.
a, Boxplot showing the number of expressed lncRNA genes represented in the library across cancer cell lines. LncRNAs with TPM >0.01 were considered and cell lines were grouped according to the tumor tissue of origin. Color legend in the right panel. Boxplot data are presented as follows: center, median; box bounds, 25% and 75% percentile; whisker, 1.5× IQR. Outliers are marked as independent dots; n, number of independent cell lines per tissue type. b, Heatmap representing the percentage of differentially expressed lncRNA genes between cancer cell lines from different tissues represented in the Albarossa library. Color code as in a. c, Sample-to-sample hierarchical clustering of cancer cell lines based on RNA-seq expression values from lncRNA genes represented in the Albarossa library. Rand index was calculated by comparing the clustering against the ideal tissue clustering. Color code as in a. d,e, Barplots displaying the average lncRNA gene complexity (d) or the percentage of evolutionary conserved lncRNA genes (e) in the original (black, all 97,817 lncRNA genes), selected (red, 24,171 lncRNA genes represented in the Albarossa library) or nonselected (gray) sets of lncRNA genes. f, Density plot showing the maximum median expression (MME) in the three indicated lncRNA groups. MME was calculated using the maximum expression value for each lncRNA gene across CCLE lines. g, Characteristics of the Albarossa library. h, Schematic of the NGS protocol developed for sequencing of the Albarossa library and the screened samples. i, Lorenz curves of the cumulative gRNA distribution in indicated CRISPR libraries. The dotted black line indicates the ideal distribution. Percentages indicate library representation at 90% of cumulative reads. BC, barcode; Fw, forward primer; Rev, reverse primer.

