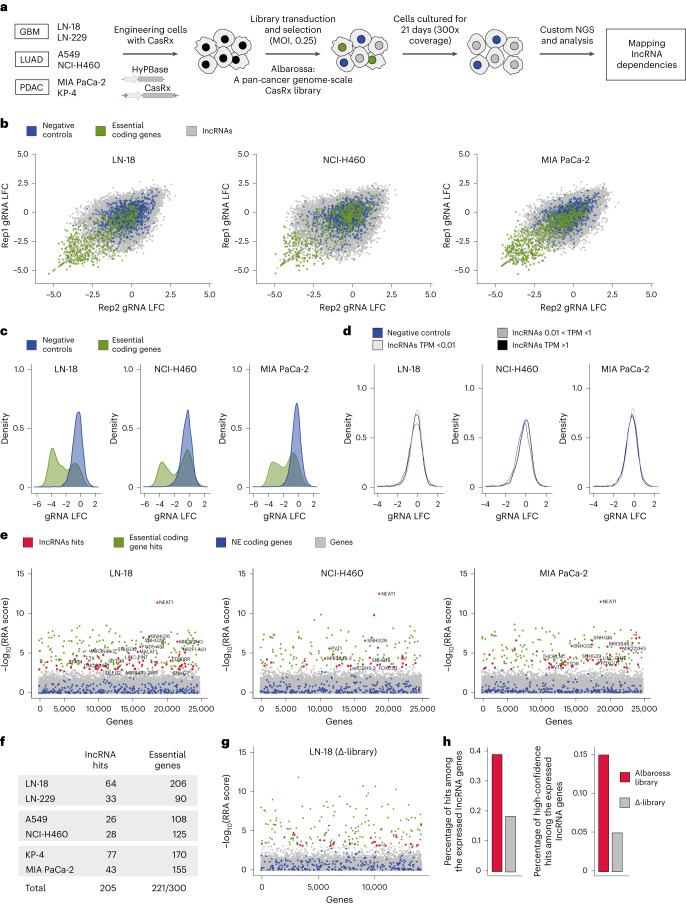
Fig. 4. Genome-scale CasRx mapping of lncRNA dependencies across different tumor types.
a, Experimental outline of CasRx-based genome-scale lncRNA fitness screening developed in this study. b, Scatterplots of gRNAs LFC between two technical screening replicates. LFC values were calculated using CPM-normalized counts, with the plasmid library serving as a baseline. Three representative screens using the cell lines indicated are shown. gRNAs targeting lncRNAs are marked gray, negative control gRNAs (gRNAs targeting NE coding genes and NT gRNAs) are blue, and positive controls gRNAs (gRNAs targeting AE coding genes) are green. c, LFC distribution of negative and positive control gRNAs in indicated screens. d, LFC distribution of negative control gRNAs and gRNAs targeting expressed or nonexpressed lncRNA genes. e, Scatterplots displaying RRA scores of screened genes, as calculated by MAGeCK. NE coding genes are marked blue, and significant hits are marked red (lncRNA hits) or green (AE coding gene hits). Remaining genes are marked gray. Selected lncRNA hits are annotated. f, Summary table of significant hits in all CasRx screens. g, Scatter plot displaying RRA, as calculated by MAGeCK, for genes screened using a LN-18 Δ-library. The Δ-library targets all lncRNA genes expressed in the LN-18 cell line (TPM > 0.01) that are not targeted by the Albarossa library. Color scheme as in e. h, Barplots displaying the percentage of hits (left) or high-confidence hits (FDR < 0.05, right) among expressed lncRNA genes in LN-18 screens deploying the Albarossa library (red) or Δ-library (gray).

