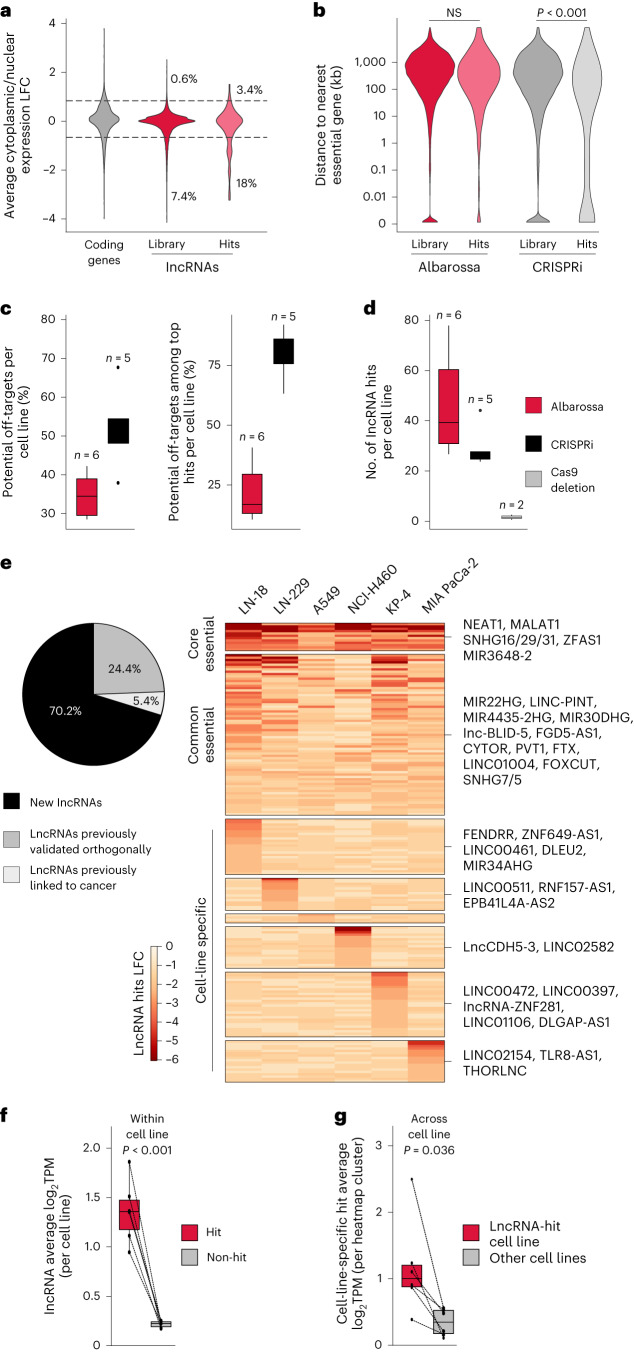
Fig. 5. CasRx-based screens solve bottlenecks linked to previous perturbation approaches and enable the identification of common and context-specific lncRNA vulnerabilities.
a, Cytoplasmic/nuclear expression LFC distributions of coding genes (gray) or for the indicated sets of lncRNAs (red/pink). The distributions represent average values for all cell lines used in this study. Genes with an LFC ≤ 0.75 or >0.75 were categorized as either nuclear-enriched or cytoplasm-enriched, respectively. b, Distance distributions of indicated sets of lncRNAs to the closest essential coding gene. Data represent screens based on CasRx (this study) and CRISPRi27. Two-sided Wilcoxon–Mann–Whitney test was used for statistical analyses. c, Boxplots showing the percentage of off-targets (left) or the percentage of off-target among the top hits (first quartile of the significant hits, based on FDR, right) per cell line. Data for our CasRx screens (red) and CRISPRi27 screens (black) are shown; n, number of independent cell lines. d, Boxplot showing the number of lncRNA hits per cell line in the CasRx (red), CRISPRi27 (black) or Cas9-based deletion15 (gray) screens; n, number of independent cell lines. e, Percentage of CasRx screening hits that have never been associated with cancer or proliferation before (black), have been associated with cancer (light gray) or whose fitness effects have been validated (light gray). The heatmap indicates unified lncRNA-specific LFC values for all lncRNA hits in the CasRx screens. Hits are clustered based on occurrence across cell lines (right panel). f, Boxplots showing the average expression of hit (red) or non-hit (gray) lncRNA genes per cell line. Lines connect the values for the same cell line; n = 6 independent cell lines. g, Boxplots showing the average expression of cell-line-specific hits as displayed in e. Each dot in the red box represents the average expression of lncRNAs in the specific cell line in which they are a hit. The connected dot in the gray box represents the average expression of the equivalent set of lncRNAs across the other cell lines; n = 6 independent cell lines. For all boxplots, data are presented as follows: center, median; box bounds, 25% and 75% percentile; whisker, 1.5× of IQR. NS, not significant.

