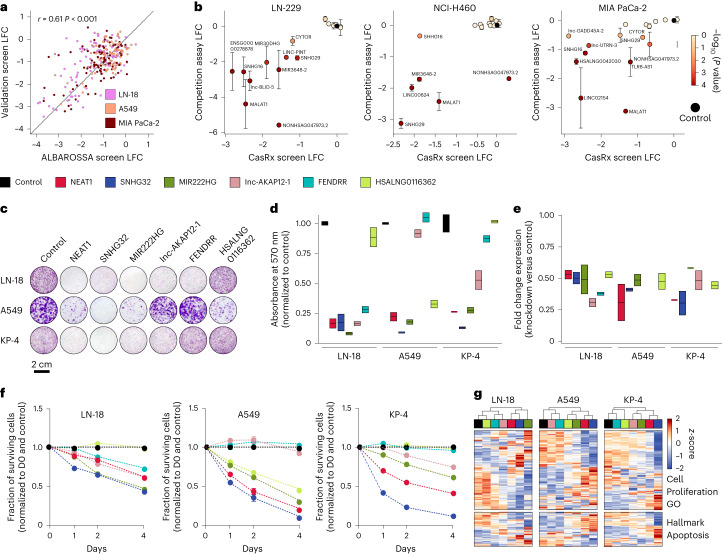
Fig. 6. Validation of lncRNA dependencies.
a, Screening-based high-throughput validation of lncRNA dependencies. Scatterplots display LFC values derived from screens performed using the Albarossa library and a ‘validation library.’ Correlation value and significance was calculated using the Pearson regression method. b, Individual hit validation using FACS-based competition assays in different cell lines. Scatterplots display LFC values for Albarossa screens and competition assays for indicated lncRNAs. LFC values represent the proportion of GFP-positive cells at day 14 versus day 0. GPF-positive cells transduced with NT gRNA served as controls. One-way analysis of variance with Dunnett’s posttest was used to compare experimental and control conditions. Error bars, s.e.m.; n = 4 technical replicates from two independent experiments. c, Validation of fitness effects linked to perturbation of indicated lncRNAs using colony formation assays. Representative images are shown for different cell lines. Cells were transduced with a vector encoding a NT gRNA or gRNAs against different lncRNAs. After 2 days of puromycin selection, cells were seeded at low confluence and stained with crystal violet after 10 days of culture. d, Quantification of colony formation assays. Colors indicate the different lncRNAs targeted; n = 2 independent experiments. e, qPCR-based quantification of knockdown levels for indicated lncRNAs. Data represent comparisons of knockdown and control conditions based on glyceraldehyde 3-phosphate dehydrogenase-normalized expression values; n = 2 independent experiments. For the boxplots, data are presented as follows: center, median; box bounds, minimum and maximum value. f, Proliferation curves indicating fitness effects linked to perturbation of indicated lncRNAs over time. LncRNAs were targeted as described in c. Cell numbers were normalized to day 0 (D0) and are indicated as fold change over controls (cells transduced with an NT gRNA); n = 2 independent experiments. g, A fraction of cells from f were collected at day 0 and processed for RNA-seq. The heatmaps show the expression pattern of genes (related to cell proliferation or apoptosis) that are significantly differentially expressed in at least one experimental condition against the corresponding control condition.

