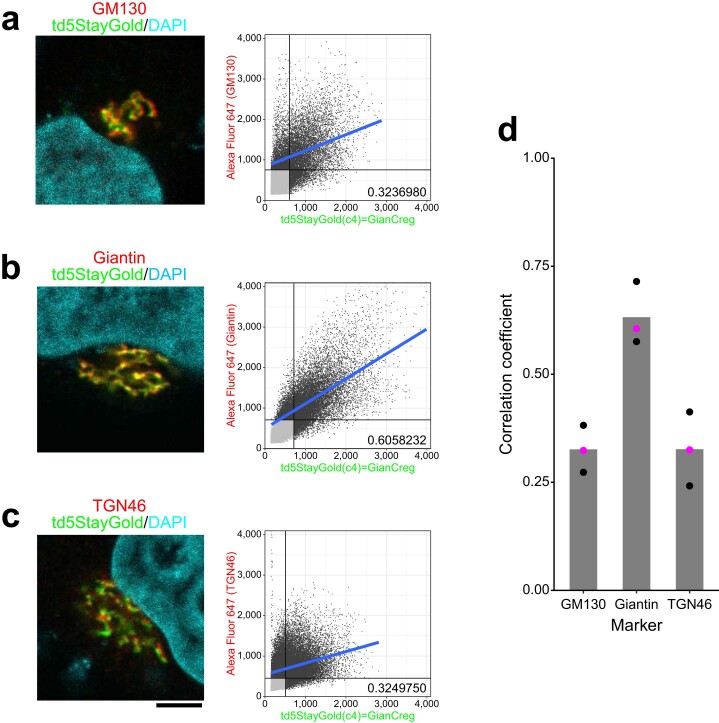
Extended Data Fig. 7. Immunocytochemistry for localizing td5StayGold(c4)=GianCreg within the Golgi complex.
HeLa cells stably expressing td5StayGold(c4)=GianCreg were chemically fixed and immunostained for three Golgi markers: GM130 (cis), Giantin (medial), and TGN46 (trans-Golgi network). Their immunosignals (Alexa Fluor 647) were imaged with td5StayGold fluorescence three-dimensionally with a z-step of 0.52 µm using a confocal microscope. For a scan format of 512 × 512 and a zoom factor of 4×, the pixel size was 0.104 µm, which was sufficiently small to make good use of the resolving power of the high–numerical-aperture (NA 1.2) objective lens. a–c, Analysis of colocalization between td5StayGold(c4)=GianCreg and GM130 (a), Giantin (b), or TGN46 (c) in a single experiment. left, Representative single-slice images. Nuclei were stained with DAPI. Scale bar, 5 µm. right, Pearson correlation plots based on 26 (a and b) and 27 (c) z-slices, showing the correlation coefficients: 0.324 (a), 0.606 (b), and 0.325 (c). d, The experiment was repeated three times. Individual correlation coefficients are plotted; the data plots derived from a–c are highlighted in magenta). The mean values are shown by gray bars.

