
Fig. 5. Visualization of td5StayGold-harboring Golgi membranes and mStayGold-harboring inner mitochondrial membranes.
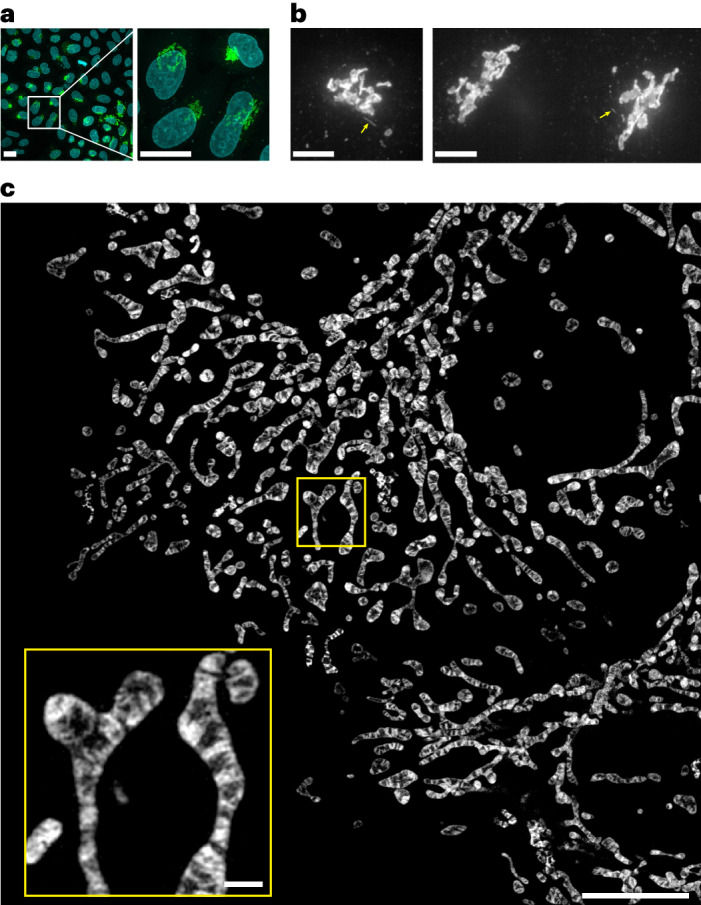
a, Confocal images of td5StayGold(c4)=GianCreg (green) and DAPI (cyan) in fixed HeLa cells. A MIP image (20 slices, 1.0-μm z step). Low (left) and high (right) magnifications. Scale bars, 20 μm. b, Volumetric and continuous imaging of HeLa cells expressing td5StayGold(c4)=GianCreg by SDSRM (SpinSR10) revealed the occurrence of fast-moving tubular structures that emerged from the Golgi apparatus (yellow arrows). Two independent experiments (left and right). Scale bars, 5 μm. See Supplementary Video 5. Similar results were obtained from 17 other independent cultured cell samples. c, A MIP of HeLa cells expressing COX8a=mStayGold. Cells were 3D scanned with a z step size of 0.11 μm over an axial range of 2.08 μm by lattice SIM (Elyra 7). SIM2 was used for image reconstruction. This MIP corresponds to the image at t = 126 s in Supplementary Video 9. Scale bars, 10 μm, 1 μm (inset). Representative of n = 3 independent samples.