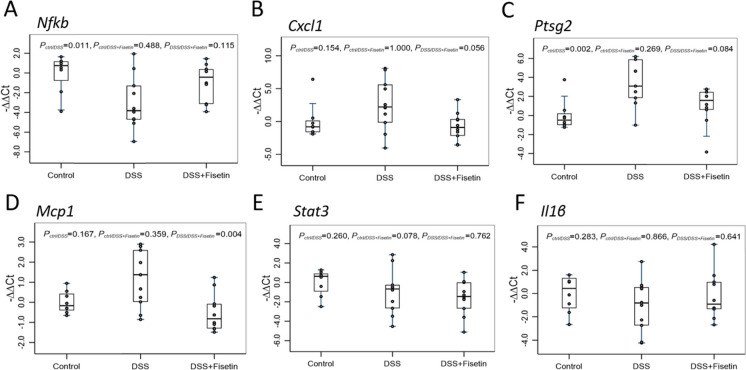
Fig. 4.
Boxplot of fold changes of SASP mRNAs (n = 8–11 per group). A Nfkb gene expression, B Cxcl1 gene expression, C Ptgs2 gene expression, D Mcp1 gene expression, E Stat3 gene expression, and F Il1β gene expression in female wild-type mice treated with DSS and DSS + Fisetin. The 2−ΔΔCt method was used to calculate and normalize the gene expression, in which − ∆∆Ct was calculated as − ∆∆Ct = average (∆Ctcontrol) − ∆Ctsample and ∆Ct = Cttarget gene − Cthousekeeping gene. The housekeeping gene was β2M. Nonparametric multiple pairwise Dunn’s test was performed to evaluate the differential gene expression among different treatments with Bonferroni adjustment applied to control for type I error

