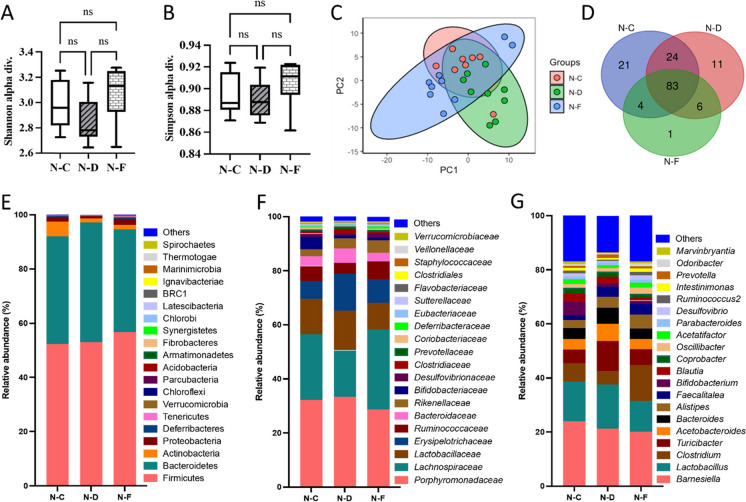
Fig. 7.
Changes in the microbiota in response to DSS exposure and Fisetin treatment in the colons of female wild-type mice. y-axis represents treatment condition, with N–C (normal-control), N-D (normal-DSS), and N-F (normal-Fisetin) (n = 8–11 per group). A Shannon diversity of the microbiota, B Simpson diversity of the microbiota, C principal component analysis (PCA), D Venn diagram of distinct bacterial genera, E relative abundance of bacterial phyla, F relative abundance of distinct bacterial families, and G relative abundance of distinct bacterial classes

