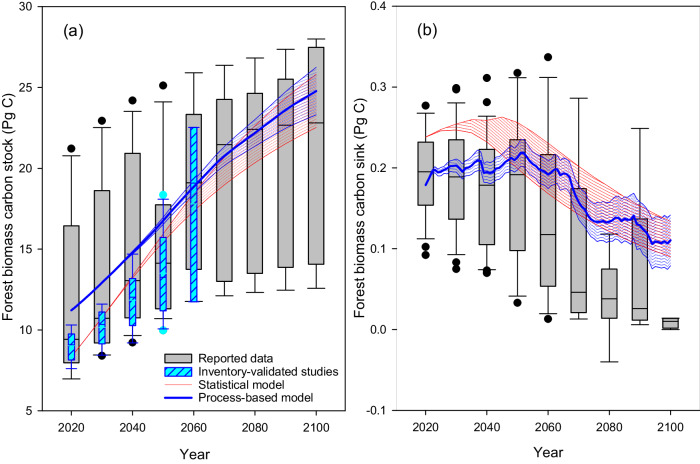
Fig. 1. Forest biomass carbon stock and sink in China.
Boxplot shows the median (center line), and the lower (10th) and upper (90th) quartiles; outliers shown as individual data points. Gray box: the pooled estimations from publications; cyan box in panel a: the reported carbon stock using models validated by historical forest inventory data; red shaded area in panels a and b: the range of carbon stocks and sinks derived from statistical model under the baseline (47% tree survival rate) and the improved management scenarios (85% tree survival rate) in this study; blue shaded area in panels a and b: the stock and sink derived from process-based simulations using DLEM under different tree survival rates (i.e. 47% and 85%) and Shared Socioeconomic Pathways scenarios in this study. The improved management practices (i.e. tree replacement and harvest rotation length extension) and wood product pool were not considered or included.

