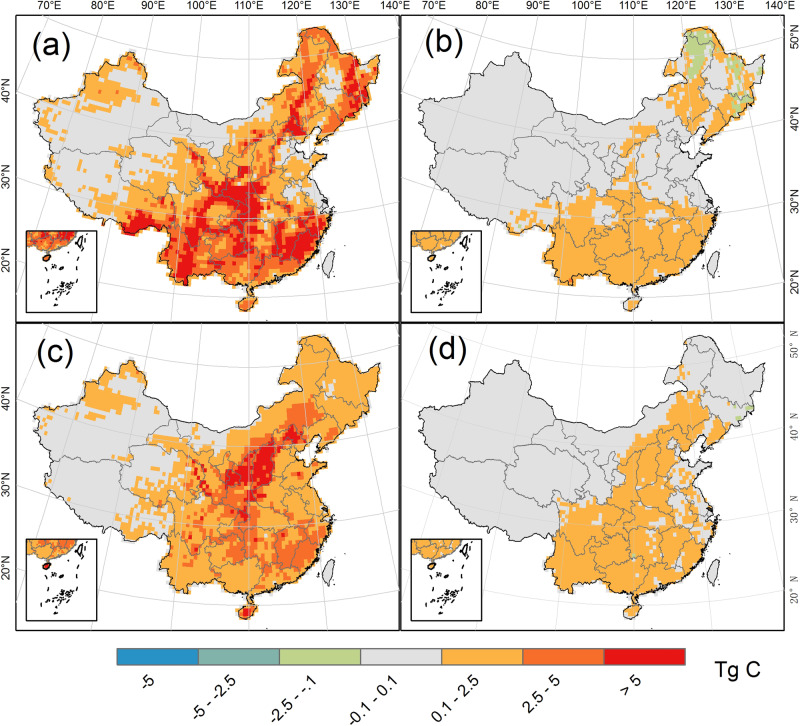
Fig. 2. The modeled biomass carbon stock change in China’s forests from 2020 to 2100.
Panels a–d indicate the accumulated changes of biomass carbon stock in non-timber natural forest, timber natural forest, non-timber planted forest, and timber planted forest, respectively; unit: Tg C (1 Tg = 0.001 Pg). The species-specific areas of timber forest were obtained from the China Forest Resource Report 2014–2018. Results derived from process-based simulations under different tree survival rates (i.e. 47% and 85%) and Shared Socioeconomic Pathways scenarios. The management practices (i.e. tree replacement and harvest rotation length extension) and wood product pool were not considered or included.

