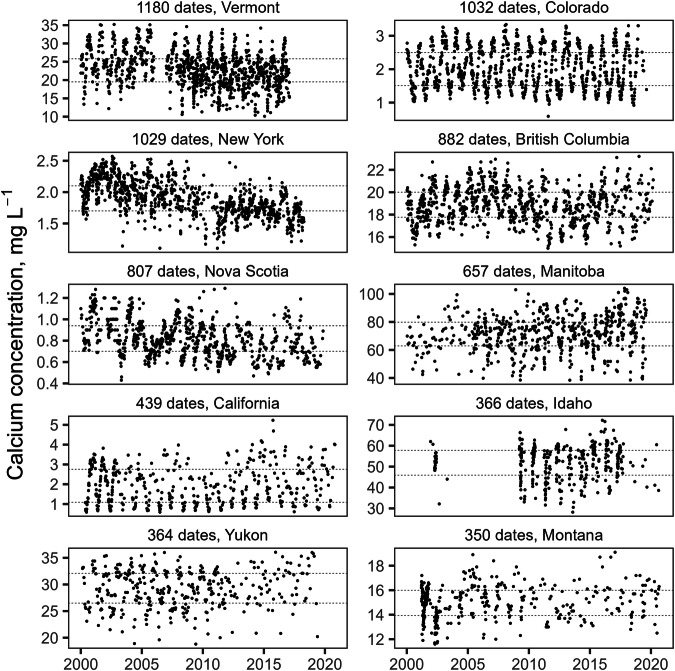
Fig. 5.
Temporal variation in dissolved calcium concentration for ten sites, selected (from among the 100 sites with data for the most dates) to have the longest temporal coverage and to come from 10 different administrative regions; source region given for each plot, along with number of dates with data. Seasonal fluctations are evident for most of the sites, but are small compared to spatial variation across Canada and the USA. Dotted lines mark the interquartile range for each site. Outliers have been removed for presentation, but were not excluded from calculation of site statistics. Note the differences in vertical scales for individual plots.

