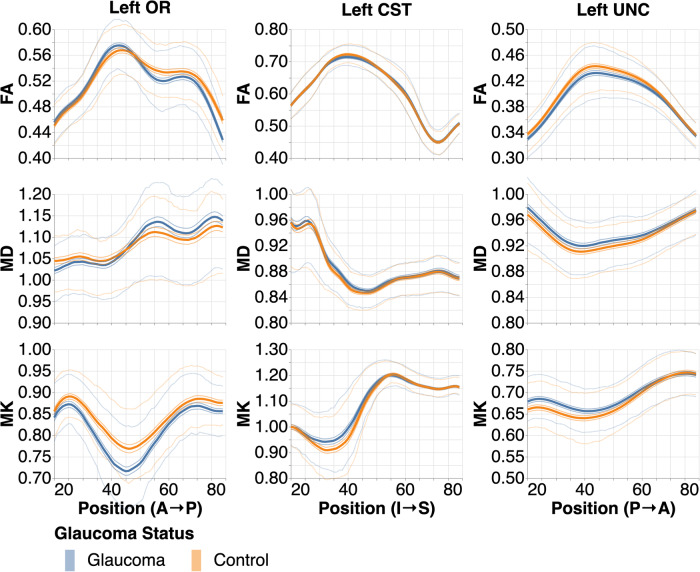
Fig. 1. Tract profiles in individuals with glaucoma and healthy controls.
Thick lines show the mean tract profiles in the left hemisphere of all bundle and tissue property combinations. The medium-thickness lines hugging the thick lines show the 95% confidence interval. The thin lines show interquartile ranges (n = 895 in each group). Positions in OR are from anterior to posterior (A → P), in the corticospinal tract (CST) are from inferior to superior (I → S), and in the uncinate (UNC) from posterior to anterior (P → A).

