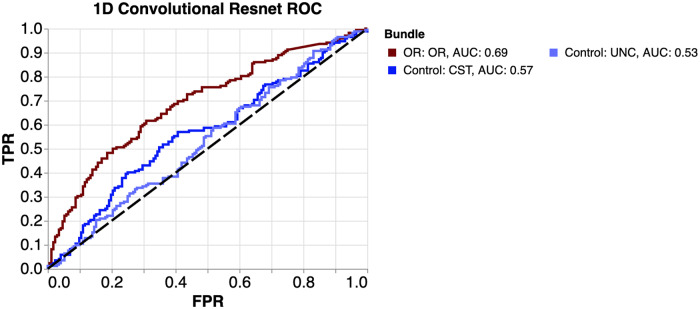
Fig. 2. Receiver operating characteristic (ROC) curves for prediction of glaucoma using the three neural networks.
Each were trained using three tissue properties from both hemispheres, but each from a different bundle. ROC curves compare true positive rate (TPR) to false positive rate (FPR) at various thresholds. Area under curve (AUC) is the summary of accuracy across all classification thresholds. Therefore, ROC/AUC metrics are invariant to the choice of decision criterion. Note that the OR in dark red have higher AUC than the control bundles.

