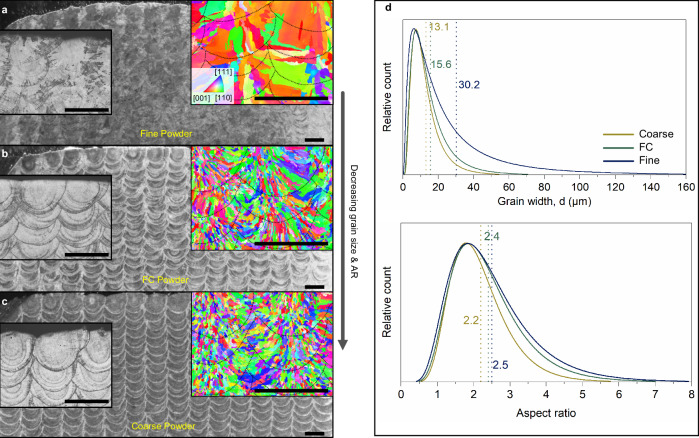
Fig. 3. PSD-driven microstructure control in DED process.
Melt pool/Microstructural observations in (a) Fine, (b) FC, and (c) Coarse powder as-built samples. All of the scales correspond to 500 µm. The EBSD maps taken along the build direction in the inset showcase the variation in grain morphology and orientation with increasing PSD. d Quantified measurements of the grain width and aspect ratio obtained for the fine, FC, and coarse powder samples.

