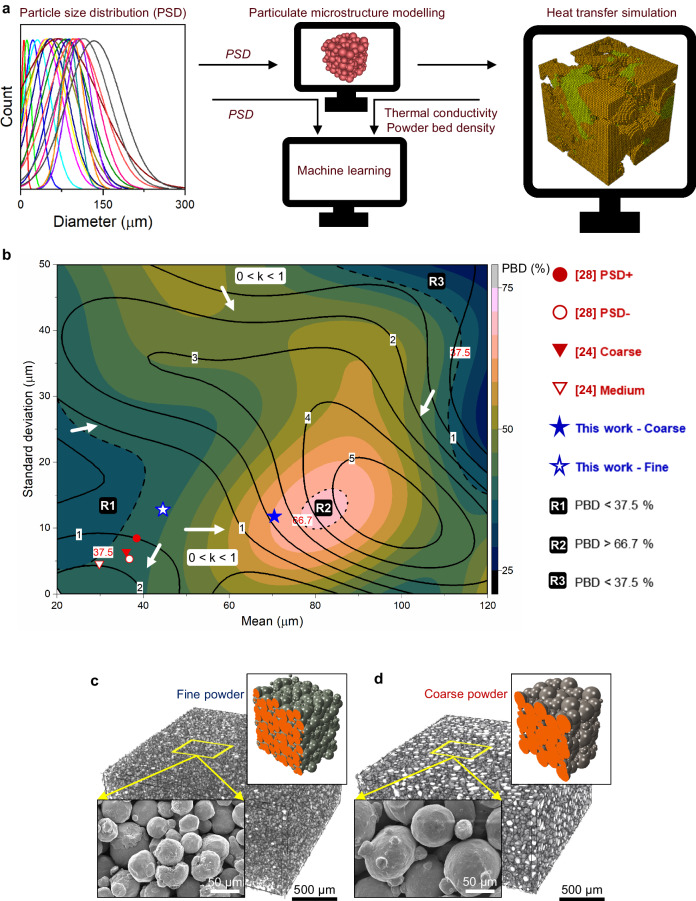
Fig. 4. ML framework employed to predict the impact of PSD on the thermophysical properties of a sintered powder bed.
a ML framework presenting the flow of data from simulated particulate microstructure to the FEA simulations and the ML algorithm. b Response curve for thermal conductivity (k) and powder bed density (PBD) obtained from the ML framework. White arrows indicate the direction of increasing k on the response curve. Representative 3D rendering of (c) fine and (d) coarse sintered powder beds analysed using µ-CT scanning, respectively, along with their respective simulated particulate microstructure. The inset images are FESEM micrographs of fine and coarse sintered powder beds taken at the same magnification.

