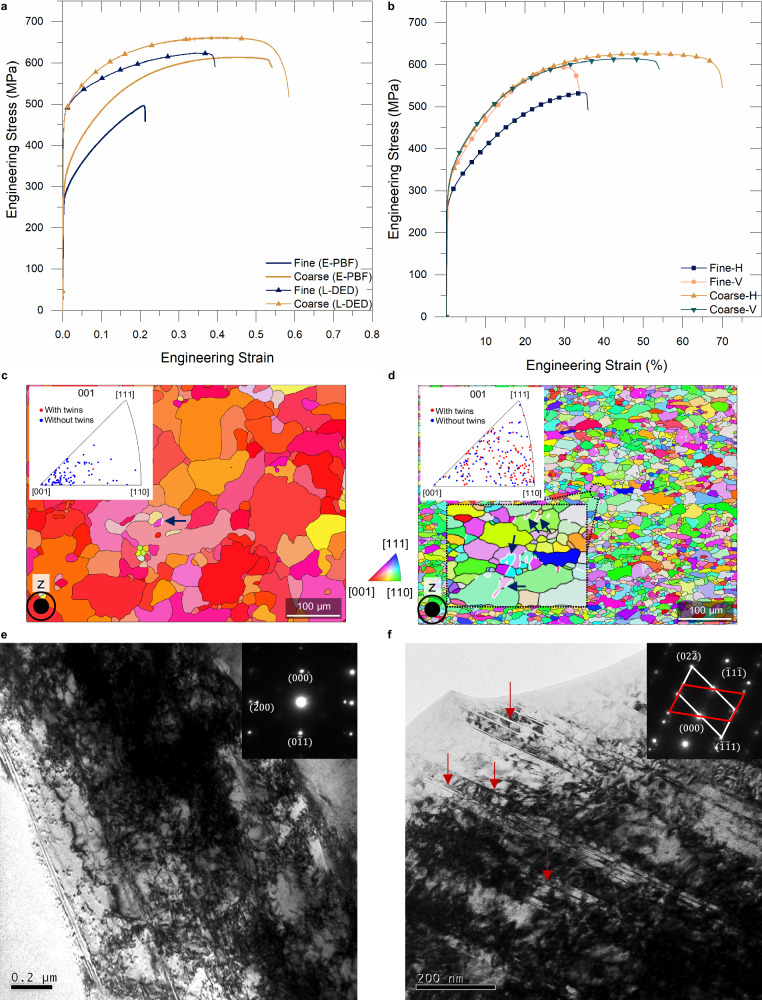
Fig. 6. Mechanical response of E-PBF and L-DED fabricated fine- and coarse-powder samples.
a Tensile response curves obtained for L-DED and E-PBF samples tested along the build direction. b Engineering stress vs strain (%) obtained for E-PBF samples highlights the improvement in mechanical isotropy attributed to the FG equiaxed microstructure obtained in the coarse-powder samples. H indicates horizontal direction and V indicates vertical direction (or build direction). c, d are IPF-z maps obtained for fine- and coarse-powder samples, respectively, taken 3 mm away from the fracture surface. The twin grain boundaries observed in the EBSD maps are colored in white and pointed by dark blue arrowheads. e TEM bright field image of fine powder sample showing stacking faults. f TEM bright field image of coarse-powder samples showing a large number of deformation nanotwins, indicated using red arrows. Inset figures in (e, f) are their corresponding selected area electron diffraction (SAED) patterns obtained using TEM. The tensile testing direction with respect to (c−f) was along the plane of the figure.

