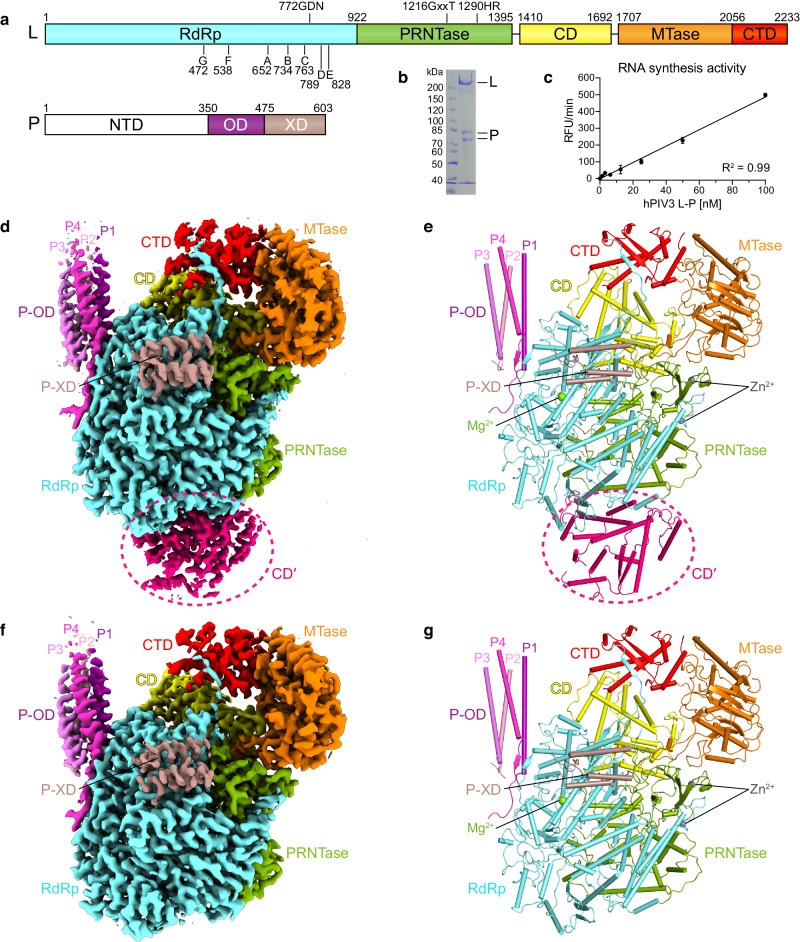
Fig. 1. Overall structure of the hPIV3 L–P complex.
a Domain organization of L and P proteins. RdRp, aquamarine; PRNTase, green; CD, yellow; MTase, orange; CTD, red; P-NTD, white; P-OD, purple; P-XD, dark salmon. The conserved motifs and residues required for functions are indicated. b SDS-PAGE analysis of the purified L–P complex. L protein and P protein have a molecular weight of 257 and 68 kilodaltons (kDa), respectively. The second P band could represent a truncated product or alternative phosphorylated state. c RNA synthesis activity as determined in a fluorescence-based primer extension assay. The bars show the mean and standard deviation for two independent experiments. d, e The cryo-EM map (d) and structure (e) of the hPIV3 L–P bound with the CD domain (CD′) of the second L. Domains are colored as depicted in (a) except for CD′ in hot pink and four copies of P-OD domains in purple (P1), light pink (P2), violet (P3) and light magenta (P4), respectively. CD′ is surrounded by a dotted circle. The magnesium ion at the RdRp active site and zinc ions in the PRNTase domain are shown as light green and gray spheres, respectively. f, g The cryo-EM map (f) and structure (g) of monomeric hPIV3 L–P. Source data are provided as a Source Data file.

