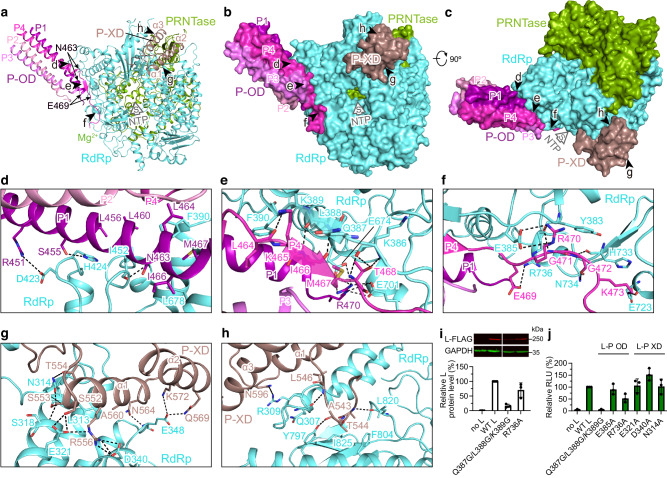
Fig. 4. L–P interaction of hPIV3.
a Overview of OD and XD domains of P binding to L. Five black arrows represent the views shown in (d–h). L and P are shown as ribbons. The region (Asn463-Glu469) that is liberated from the long helix of P4 is labeled. The putative NTP entry is indicated by a thick arrow. b The same view as in (a) with L and P shown as surface. c Rotated view by 90o about the horizontal axis from (b). d–f Magnified view of the interactions between L and P-OD. g, h Magnified view of the interactions between L and P-XD. Polar interactions are indicated by dashed lines. i, j Expression level (i) and polymerase activity (j) evaluation of hPIV3 L mutants with substitutions on the L–P OD interface and the L–P XD interface, as measured by Western blot analysis and a luciferase minigenome assay, respectively. The bars show the mean and standard deviation for three independent experiments (the data points for each experiment are shown). Note that (i) shows a single Western blot with intervening lanes excised. Source data are provided as a Source Data file.

