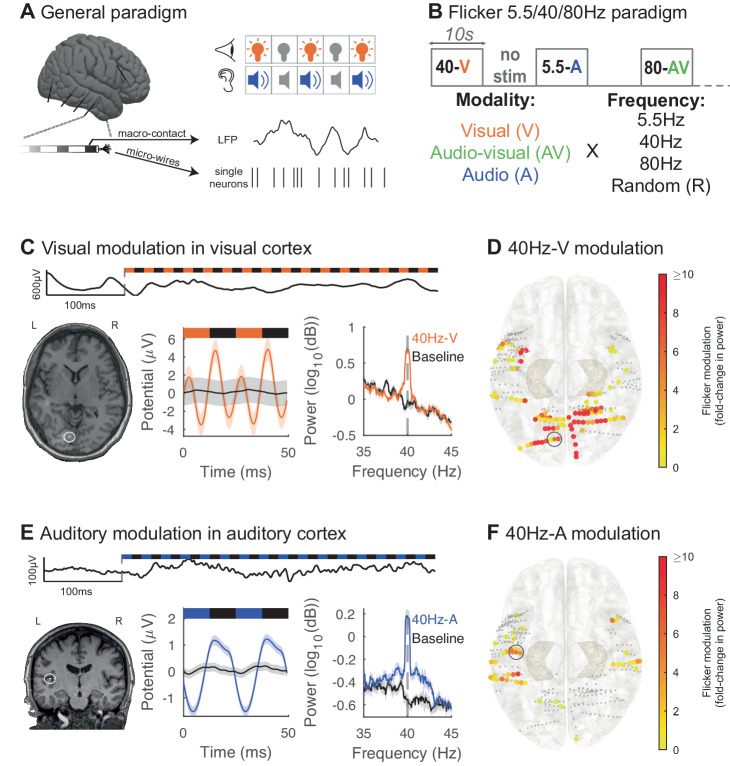
Fig. 1. Auditory and visual flicker induce a steady-state evoked potential in human sensory regions.
A Intracranial local field potential (LFP) and single neuron activity were recorded while we exposed subjects to visual and auditory stimulation pulses. B In this first paradigm, we exposed subjects to 10 s trials of visual (V, orange), audio-visual (AV, green) or auditory (A, blue) flicker at 5.5 Hz, 40 Hz, 80 Hz and random non-periodic stimuli, as well as no stimulation or baseline (total of 13 conditions). C Example of 40 Hz-V steady-state evoked potential (EP) in early visual area lingual gyrus in one subject. Top: raw LFP trace at the beginning of a 40 Hz-V trial. Bottom left: post-operative computed tomography (CT) scan overlaid on pre-operative magnetic resonance imaging (MRI), with contact from which results are shown highlighted with white circle. Bottom middle: LFP response to 40 Hz-V flicker (orange) and baseline (black), averaged over 2 cycles of the stimulus. Bottom right: average power spectral density (PSD) plot of 40 Hz-V flicker versus baseline. For these last two plots, lines and shaded areas indicate mean +/− standard error of the mean (SEM). D Response to 40Hz-V stimulation across contacts (dots) located in early visual and auditory areas, on the Montreal Neurological Institute (MNI) normalized brain (top view), with color representing fold-change in power at the frequency of stimulation, capped at 10-fold increase to best visualize this range (n = 337 channels, 12 sessions, 12 subjects). Smaller gray dots indicate channels with no significant response. 34 contacts had modulation greater than 10-fold. The contact from which results are represented in (C) is highlighted with a gray circle. E Same as in (C) but illustrating 40 Hz-A steady-state EP in Heschl’s gyrus or transverse temporal gyrus (primary auditory area) from one subject during 40 Hz auditory stimulation (blue) or baseline (black). F Same as (D) but showing response to 40 Hz-A stimulation (n = 337 channels, 12 sessions, 12 subjects). One contact had modulation greater than the 10-fold threshold. The contact from which results are represented in (E) is highlighted with a gray circle. Source data are provided as a Source Data file.

