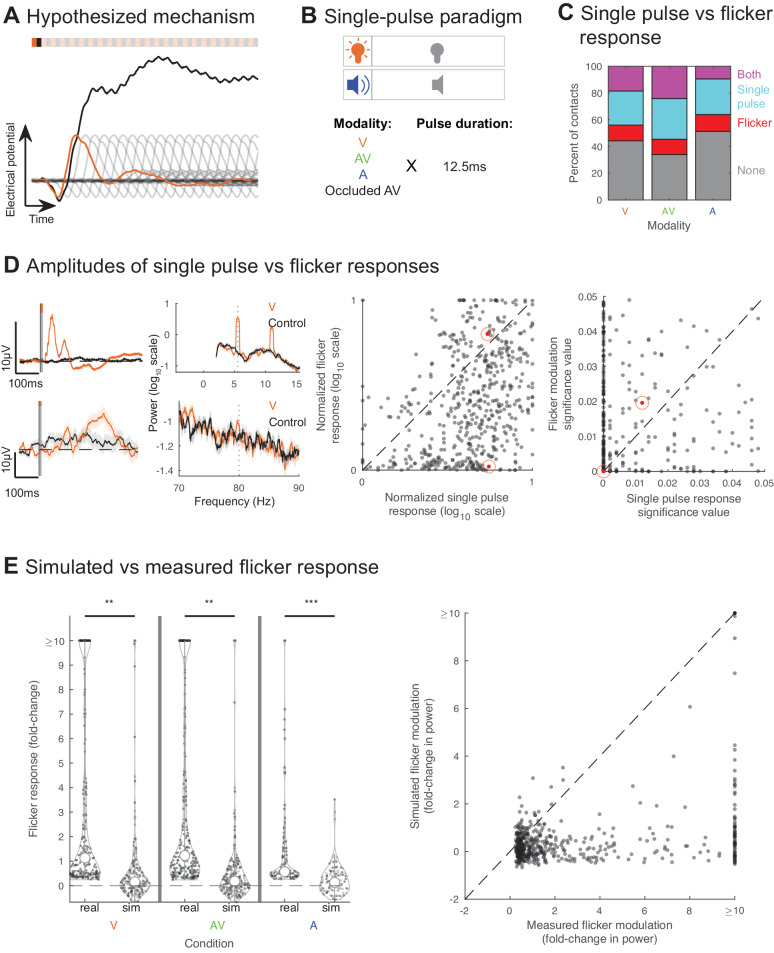
Fig. 4. Flicker modulation does not result from linear superposition of single pulse evoked potentials.
A Schematic of the hypothesis that the steady state EP results from linear superposition of single pulse EPs: 40 Hz steady state EP (black) is hypothesized to result from the response to a single visual pulse (orange) that is repeated every 25 ms (transparent gray) and linearly summed. B 6 subjects were exposed to single 12.5 ms pulses in the visual (orange), audio-visual (green), and auditory (blue) modalities or relative occluded flicker (with sleep mask and earplugs) as control. C Percent of contacts showing response to flicker-only (red), single pulse-only (cyan), both flicker and single pulses (purple), and no response (gray), with the visual, audiovisual, and auditory modality, respectively. D Left: Example contacts that responded strongly to both (top) single visual pulses (left) and visual flicker (right) or more strongly to single pulses (bottom) during stimulation relative to control (black). Single-pulse EP (control is relative occluded audio-visual) and power spectral density (PSD) plots (control is baseline) shown for each. Lines and shaded areas: mean +/− SEM. Middle: Steady-state EP versus single-pulse EP amplitude, normalized by subject and stimulation modality; each dot represents one contact’s responses for a given modality; contacts with both significant steady-state EP and single-pulse EP were included (n = 319 contacts, 6 subjects). Red dots indicate examples on left. Right: Significance values of flicker versus single pulse response. E Left: Steady-state EP fold-change in power at 40 Hz in the visual, audio-visual, and auditory modalities, for real and simulated data across contacts (two-sided t-test; visual condition p = 0.0093, audio-visual condition p = 0.0081, auditory condition p = 2.5473 × 10⁻⁶; p-values are uncorrected for multiple comparisons and are lower than Bonferroni correction for 3 comparisons; n = 554 contacts, 6 subjects.) Only contacts showing significant flicker modulation in the real data were included. **p < 0.01, ***p < 0.001, open circles: medians, vertical lines: whisker plot, dots: each contact. Right: for those same contacts, amplitude of flicker steady-state EPs calculated using real data (x-axis) versus using simulated data (y-axis). Dots: one contact and modality. Source data are provided as a Source Data file.

