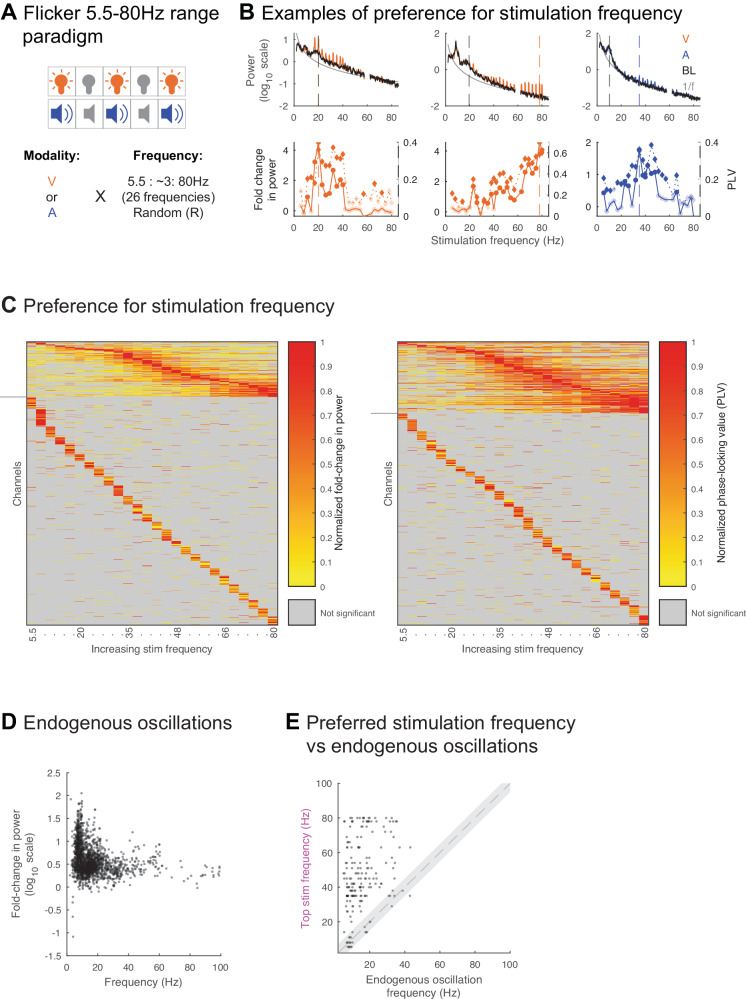
Fig. 5. Flicker response is dependent on intrinsic circuit properties.
A In the Flicker 5.5–80 Hz range paradigm, 8 subjects (11 sessions) were exposed to either visual (V, orange) or auditory (B, blue) modalities at 26 different frequencies spanning 5.5–80 Hz, random non-periodic flicker, and baseline (no stimulation). B Example contacts showing endogenous oscillations and response to stimulation frequencies. Top: power spectral density (PSD) during stimulation at each of 26 flicker frequencies, showing power values at the stimulation frequency +/− 1 Hz overlaid on the average baseline PSD (black) and aperiodic fit (1/f, gray). Lines and shading: mean +/− SEM. Bottom: fold-change in power (solid line) and phase-locking value (PLV, dotted line) for each stimulation condition. Vertical dashed colored line: stimulation frequency leading to maximal modulation, vertical dashed gray line: frequency of detected endogenous oscillation closest to top stimulation frequency, solid discs: significant fold-change, solid diamonds: significant PLV. C Normalized fold-change in power (left) at the frequency of stimulation and PLV (right), for each channel (rows) and frequency of stimulation (columns), normalized across stimulation frequencies. Some channels are repeated for subjects who underwent both the visual and auditory versions of the Flicker 5.5–80 Hz range paradigm (see Table S4). Channels with significant modulation to more than 6 stimulation frequencies shown above horizontal gray lines. Channels are ordered by top stimulation frequency from lowest to highest. Channels without significant modulation not shown. D Fold-change in power relative to aperiodic fit at the peak of each identified endogenous oscillation versus the frequency of that endogenous oscillation for all identified endogenous oscillations (see Methods) across all contacts (n = 904 contacts, 8 subjects, 11 sessions). Dot: 1 contact’s endogenous oscillation in a session. E Frequency of stimulation leading to maximal fold-change in power (top stimulation frequency) versus closest detected endogenous frequency, for all contacts (n = 184 contacts, 8 subjects, 11 sessions) that showed at least one endogenous oscillation at baseline and significant response to more than 6 of the flicker stimulation frequencies tested. Dot: one contact, dashed line: x = y, gray shaded area: +/−5 Hz from x = y. Source data are provided as a Source Data file.

